29
/
en
AIzaSyAYiBZKx7MnpbEhh9jyipgxe19OcubqV5w
April 1, 2024
240274
Singapore
SGP
true
2
1
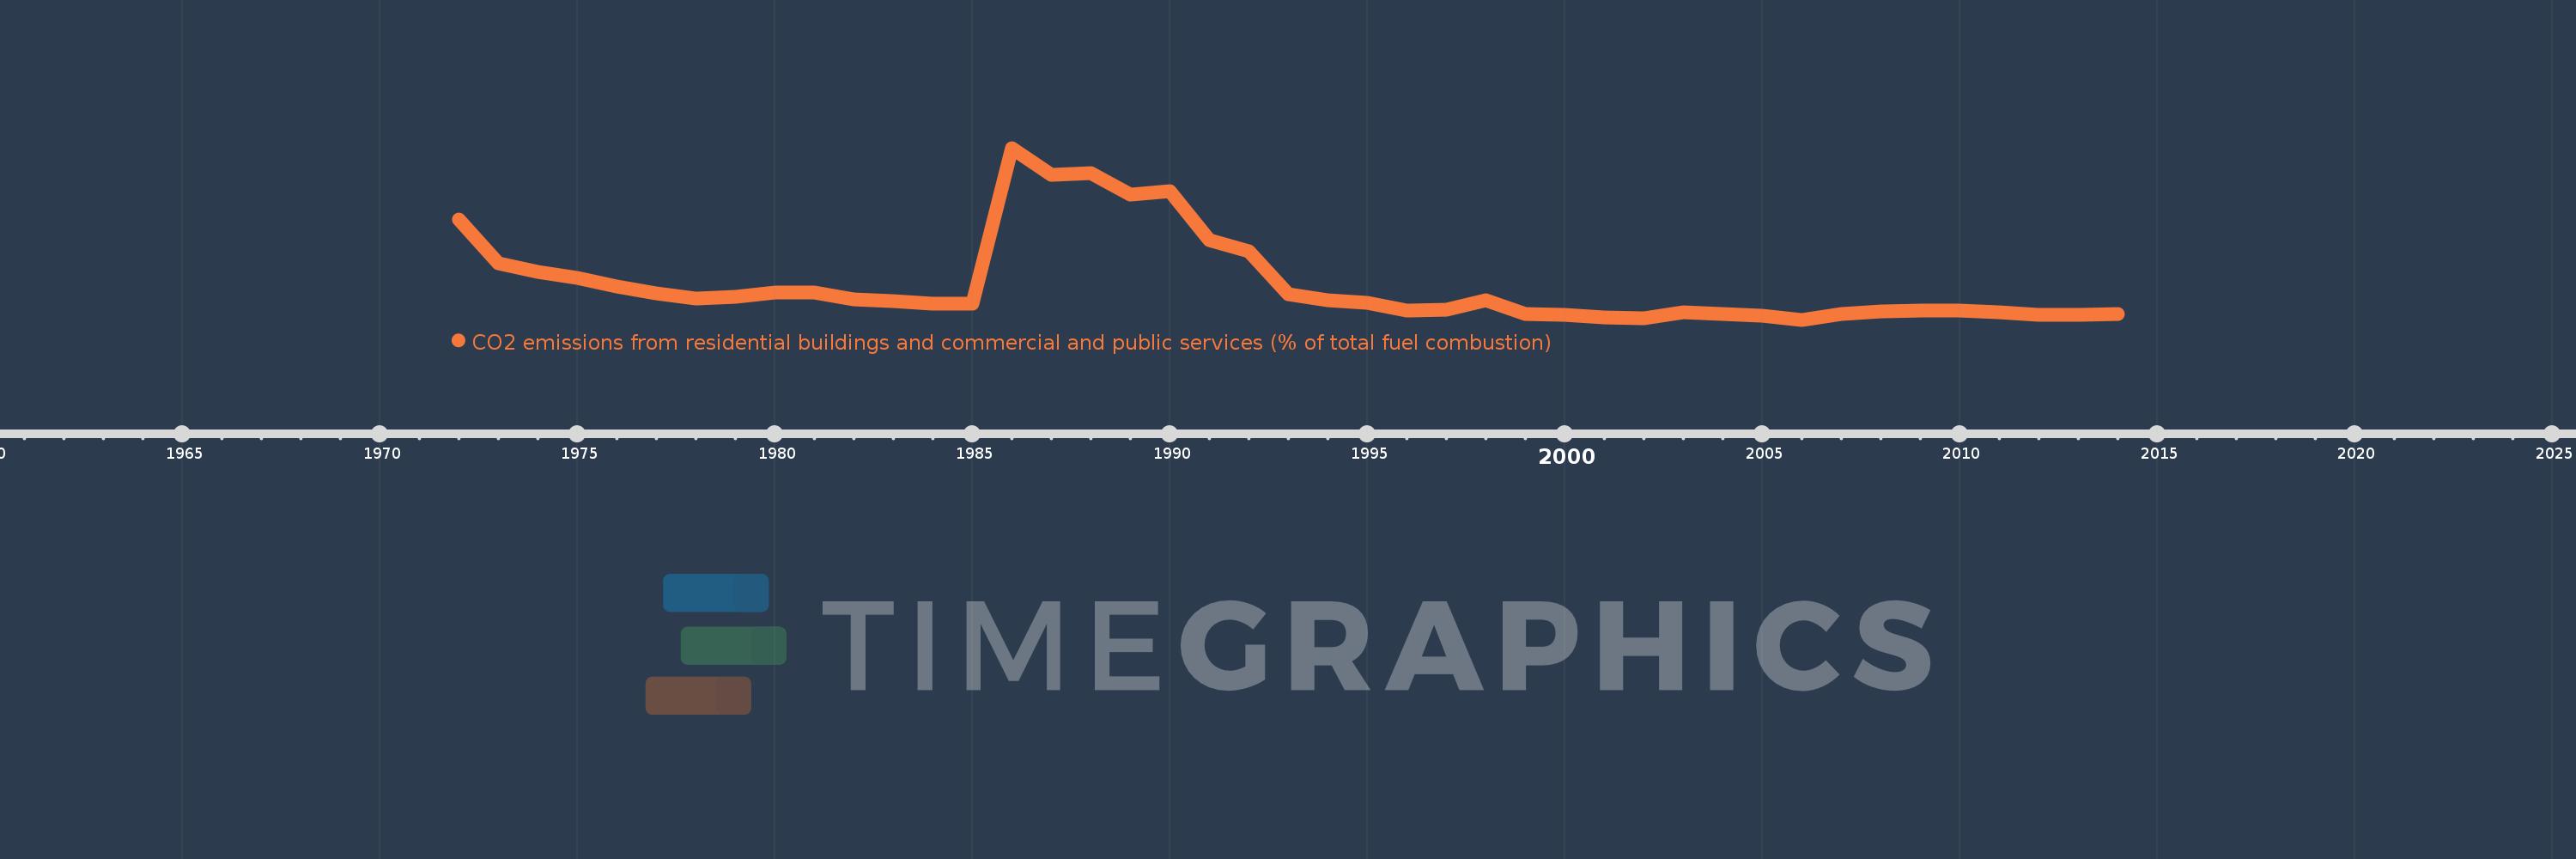
CO2 emissions from residential buildings and commercial and public services (% of total fuel combustion)
2014,2013,2012,2011,2010,2009,2008,2007,2006,2005,2004,2003,2002,2001,2000,1999,1998,1997,1996,1995,1994,1993,1992,1991,1990,1989,1988,1987,1986,1985,1984,1983,1982,1981,1980,1979,1978,1977,1976,1975,1974,1973,1972
This statistics in other country:
AlbaniaAlgeriaAngolaArab WorldArgentinaArmeniaAustraliaAustriaAzerbaijanBahrainBangladeshBelarusBelgiumBeninBoliviaBosnia and HerzegovinaBotswanaBrazilBrunei DarussalamBulgariaCambodiaCameroonCanadaCaribbean small statesCentral Europe and the BalticsChileChinaColombiaCongo, Dem. Rep.Congo, Rep.Costa RicaCote d'IvoireCroatiaCubaCuracaoCyprusCzech RepublicDenmarkDominican RepublicEarly-demographic dividendEast Asia & PacificEast Asia & Pacific (excluding high income)East Asia & Pacific (IDA & IBRD countries)EcuadorEgypt, Arab Rep.El SalvadorEritreaEstoniaEthiopiaEuro areaEurope & Central AsiaEurope & Central Asia (excluding high income)Europe & Central Asia (IDA & IBRD countries)European UnionFinlandFragile and conflict affected situationsFranceGabonGeorgiaGermanyGhanaGibraltarGreeceGuatemalaHaitiHeavily indebted poor countries (HIPC)High incomeHondurasHong Kong SAR, ChinaHungaryIBRD onlyIcelandIDA & IBRD totalIDA blendIDA onlyIDA totalIndiaIndonesiaIran, Islamic Rep.IraqIrelandIsraelItalyJamaicaJapanJordanKazakhstanKenyaKorea, Dem. People’s Rep.Korea, Rep.KosovoKuwaitKyrgyz RepublicLate-demographic dividendLatin America & Caribbean Latin America & Caribbean (excluding high income)Latin America & the Caribbean (IDA & IBRD countries)LatviaLeast developed countries: UN classificationLebanonLibyaLithuaniaLow & middle incomeLow incomeLower middle incomeLuxembourgMacedonia, FYRMalaysiaMaltaMauritiusMexicoMiddle East & North AfricaMiddle East & North Africa (excluding high income)Middle East & North Africa (IDA & IBRD countries)Middle incomeMoldovaMongoliaMontenegroMoroccoMozambiqueMyanmarNamibiaNepalNetherlandsNew ZealandNicaraguaNigerNigeriaNorth AmericaNorwayOECD membersOmanOther small statesPakistanPanamaParaguayPeruPhilippinesPolandPortugalPost-demographic dividendPre-demographic dividendQatarRomaniaRussian FederationSaudi ArabiaSenegalSerbiaSingaporeSlovak RepublicSloveniaSmall statesSouth AfricaSouth AsiaSouth Asia (IDA & IBRD)South SudanSpainSri LankaSub-Saharan Africa Sub-Saharan Africa (excluding high income)Sub-Saharan Africa (IDA & IBRD countries)SudanSwedenSwitzerlandSyrian Arab RepublicTajikistanTanzaniaThailandTogoTrinidad and TobagoTunisiaTurkeyTurkmenistanUkraineUnited Arab EmiratesUnited KingdomUnited StatesUpper middle incomeUruguayUzbekistanVenezuela, RBVietnamWorldYemen, Rep.ZambiaZimbabwe Timeline:
This timeline shows a graph from 1972 to 2014 of Singapore. No data until 1971. Number of actual observations by date: 43.
Source name:
World Development Indicators
Source organization:
IEA Statistics © OECD/IEA 2014 (http://www.iea.org/stats/index.asp), subject to https://www.iea.org/t&c/termsandconditions/
Categories, topics:
Environment
Last updated:
apr 23, 2017
Indicators value changes by year
At the date of observation
Value
Absolute change
Change from previous value
jan 1, 1972
5.116
+5.116
0.0%
jan 1, 1973
3.324
-1.791
-35.02%
jan 1, 1974
2.956
-0.368
-11.08%
jan 1, 1975
2.719
-0.237
-8.02%
jan 1, 1976
2.37
-0.349
-12.84%
jan 1, 1977
2.083
-0.286
-12.08%
jan 1, 1978
1.866
-0.217
-10.41%
jan 1, 1979
1.957
+0.091
4.88%
jan 1, 1980
2.131
+0.174
8.87%
jan 1, 1981
2.134
+0.003
0.16%
jan 1, 1982
1.848
-0.287
-13.43%
jan 1, 1983
1.786
-0.062
-3.36%
jan 1, 1984
1.655
-0.131
-7.35%
jan 1, 1985
1.657
+0.003
0.16%
jan 1, 1986
8.072
+6.415
387.13%
jan 1, 1987
6.956
-1.116
-13.83%
jan 1, 1988
7.023
+0.067
0.96%
jan 1, 1989
6.142
-0.881
-12.54%
jan 1, 1990
6.309
+0.167
2.72%
jan 1, 1991
4.282
-2.028
-32.14%
jan 1, 1992
3.808
-0.473
-11.06%
jan 1, 1993
2.039
-1.769
-46.46%
jan 1, 1994
1.798
-0.241
-11.81%
jan 1, 1995
1.712
-0.086
-4.77%
jan 1, 1996
1.384
-0.328
-19.17%
jan 1, 1997
1.429
+0.044
3.21%
jan 1, 1998
1.809
+0.38
26.61%
jan 1, 1999
1.242
-0.567
-31.34%
jan 1, 2000
1.19
-0.051
-4.14%
jan 1, 2001
1.092
-0.098
-8.26%
jan 1, 2002
1.07
-0.022
-1.99%
jan 1, 2003
1.308
+0.237
22.15%
jan 1, 2004
1.231
-0.076
-5.83%
jan 1, 2005
1.161
-0.07
-5.71%
jan 1, 2006
1.004
-0.157
-13.55%
jan 1, 2007
1.228
+0.224
22.33%
jan 1, 2008
1.346
+0.118
9.64%
jan 1, 2009
1.374
+0.028
2.07%
jan 1, 2010
1.39
+0.016
1.18%
jan 1, 2011
1.312
-0.079
-5.66%
jan 1, 2012
1.2
-0.112
-8.54%
jan 1, 2013
1.214
+0.014
1.17%
jan 1, 2014
1.246
+0.032
2.64%
Ranking of countries by current statistics by years


Comments: