29
/
en
AIzaSyAYiBZKx7MnpbEhh9jyipgxe19OcubqV5w
April 1, 2024
171514
Kuwait
KWT
true
2
1
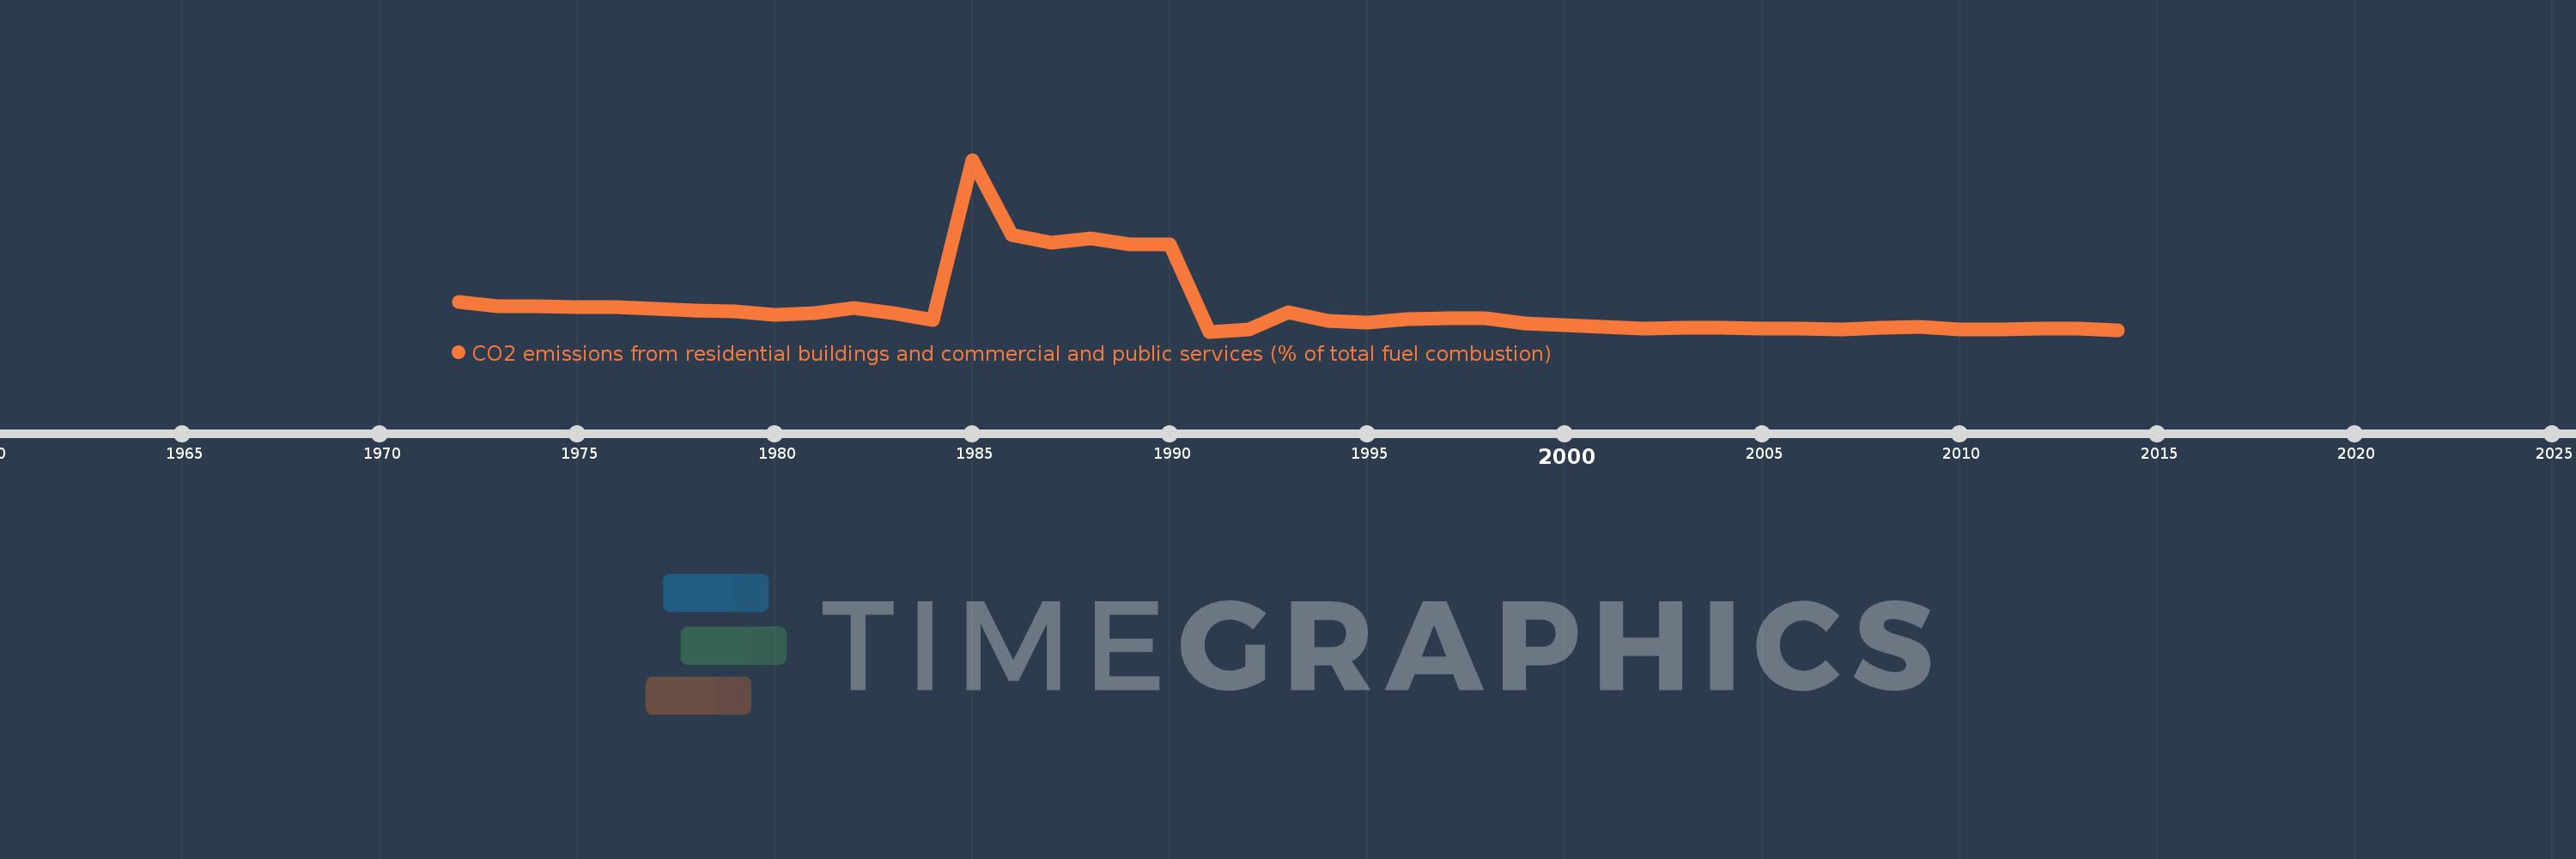
CO2 emissions from residential buildings and commercial and public services (% of total fuel combustion)
2014,2013,2012,2011,2010,2009,2008,2007,2006,2005,2004,2003,2002,2001,2000,1999,1998,1997,1996,1995,1994,1993,1992,1991,1990,1989,1988,1987,1986,1985,1984,1983,1982,1981,1980,1979,1978,1977,1976,1975,1974,1973,1972
This statistics in other country:
AlbaniaAlgeriaAngolaArab WorldArgentinaArmeniaAustraliaAustriaAzerbaijanBahrainBangladeshBelarusBelgiumBeninBoliviaBosnia and HerzegovinaBotswanaBrazilBrunei DarussalamBulgariaCambodiaCameroonCanadaCaribbean small statesCentral Europe and the BalticsChileChinaColombiaCongo, Dem. Rep.Congo, Rep.Costa RicaCote d'IvoireCroatiaCubaCuracaoCyprusCzech RepublicDenmarkDominican RepublicEarly-demographic dividendEast Asia & PacificEast Asia & Pacific (excluding high income)East Asia & Pacific (IDA & IBRD countries)EcuadorEgypt, Arab Rep.El SalvadorEritreaEstoniaEthiopiaEuro areaEurope & Central AsiaEurope & Central Asia (excluding high income)Europe & Central Asia (IDA & IBRD countries)European UnionFinlandFragile and conflict affected situationsFranceGabonGeorgiaGermanyGhanaGibraltarGreeceGuatemalaHaitiHeavily indebted poor countries (HIPC)High incomeHondurasHong Kong SAR, ChinaHungaryIBRD onlyIcelandIDA & IBRD totalIDA blendIDA onlyIDA totalIndiaIndonesiaIran, Islamic Rep.IraqIrelandIsraelItalyJamaicaJapanJordanKazakhstanKenyaKorea, Dem. People’s Rep.Korea, Rep.KosovoKuwaitKyrgyz RepublicLate-demographic dividendLatin America & Caribbean Latin America & Caribbean (excluding high income)Latin America & the Caribbean (IDA & IBRD countries)LatviaLeast developed countries: UN classificationLebanonLibyaLithuaniaLow & middle incomeLow incomeLower middle incomeLuxembourgMacedonia, FYRMalaysiaMaltaMauritiusMexicoMiddle East & North AfricaMiddle East & North Africa (excluding high income)Middle East & North Africa (IDA & IBRD countries)Middle incomeMoldovaMongoliaMontenegroMoroccoMozambiqueMyanmarNamibiaNepalNetherlandsNew ZealandNicaraguaNigerNigeriaNorth AmericaNorwayOECD membersOmanOther small statesPakistanPanamaParaguayPeruPhilippinesPolandPortugalPost-demographic dividendPre-demographic dividendQatarRomaniaRussian FederationSaudi ArabiaSenegalSerbiaSingaporeSlovak RepublicSloveniaSmall statesSouth AfricaSouth AsiaSouth Asia (IDA & IBRD)South SudanSpainSri LankaSub-Saharan Africa Sub-Saharan Africa (excluding high income)Sub-Saharan Africa (IDA & IBRD countries)SudanSwedenSwitzerlandSyrian Arab RepublicTajikistanTanzaniaThailandTogoTrinidad and TobagoTunisiaTurkeyTurkmenistanUkraineUnited Arab EmiratesUnited KingdomUnited StatesUpper middle incomeUruguayUzbekistanVenezuela, RBVietnamWorldYemen, Rep.ZambiaZimbabwe Timeline:
This timeline shows a graph from 1972 to 2014 of Kuwait. No data until 1971. Number of actual observations by date: 43.
Source name:
World Development Indicators
Source organization:
IEA Statistics © OECD/IEA 2014 (http://www.iea.org/stats/index.asp), subject to https://www.iea.org/t&c/termsandconditions/
Categories, topics:
Environment
Last updated:
apr 23, 2017
Indicators value changes by year
At the date of observation
Value
Absolute change
Change from previous value
jan 1, 1972
1.497
+1.497
0.0%
jan 1, 1973
1.359
-0.138
-9.19%
jan 1, 1974
1.354
-0.005
-0.4%
jan 1, 1975
1.337
-0.017
-1.26%
jan 1, 1976
1.325
-0.012
-0.91%
jan 1, 1977
1.275
-0.049
-3.73%
jan 1, 1978
1.215
-0.06
-4.73%
jan 1, 1979
1.2
-0.015
-1.22%
jan 1, 1980
1.093
-0.107
-8.89%
jan 1, 1981
1.135
+0.042
3.82%
jan 1, 1982
1.307
+0.172
15.18%
jan 1, 1983
1.155
-0.153
-11.68%
jan 1, 1984
0.926
-0.229
-19.84%
jan 1, 1985
5.898
+4.973
537.22%
jan 1, 1986
3.566
-2.333
-39.55%
jan 1, 1987
3.334
-0.231
-6.49%
jan 1, 1988
3.454
+0.12
3.59%
jan 1, 1989
3.286
-0.168
-4.85%
jan 1, 1990
3.271
-0.015
-0.47%
jan 1, 1991
0.576
-2.695
-82.4%
jan 1, 1992
0.644
+0.069
11.95%
jan 1, 1993
1.176
+0.532
82.59%
jan 1, 1994
0.919
-0.258
-21.91%
jan 1, 1995
0.858
-0.061
-6.63%
jan 1, 1996
0.959
+0.101
11.74%
jan 1, 1997
0.986
+0.027
2.86%
jan 1, 1998
0.982
-0.004
-0.42%
jan 1, 1999
0.824
-0.158
-16.09%
jan 1, 2000
0.772
-0.052
-6.31%
jan 1, 2001
0.713
-0.059
-7.65%
jan 1, 2002
0.677
-0.036
-5.03%
jan 1, 2003
0.689
+0.012
1.83%
jan 1, 2004
0.693
+0.004
0.54%
jan 1, 2005
0.658
-0.035
-5.05%
jan 1, 2006
0.664
+0.006
0.92%
jan 1, 2007
0.639
-0.025
-3.79%
jan 1, 2008
0.696
+0.057
8.98%
jan 1, 2009
0.727
+0.03
4.33%
jan 1, 2010
0.638
-0.089
-12.25%
jan 1, 2011
0.637
-0.001
-0.15%
jan 1, 2012
0.675
+0.038
6.03%
jan 1, 2013
0.663
-0.012
-1.83%
jan 1, 2014
0.618
-0.044
-6.69%
Ranking of countries by current statistics by years


Comments: