29
/
en
AIzaSyAYiBZKx7MnpbEhh9jyipgxe19OcubqV5w
April 1, 2024
76933
Bahrain
BHR
true
2
1
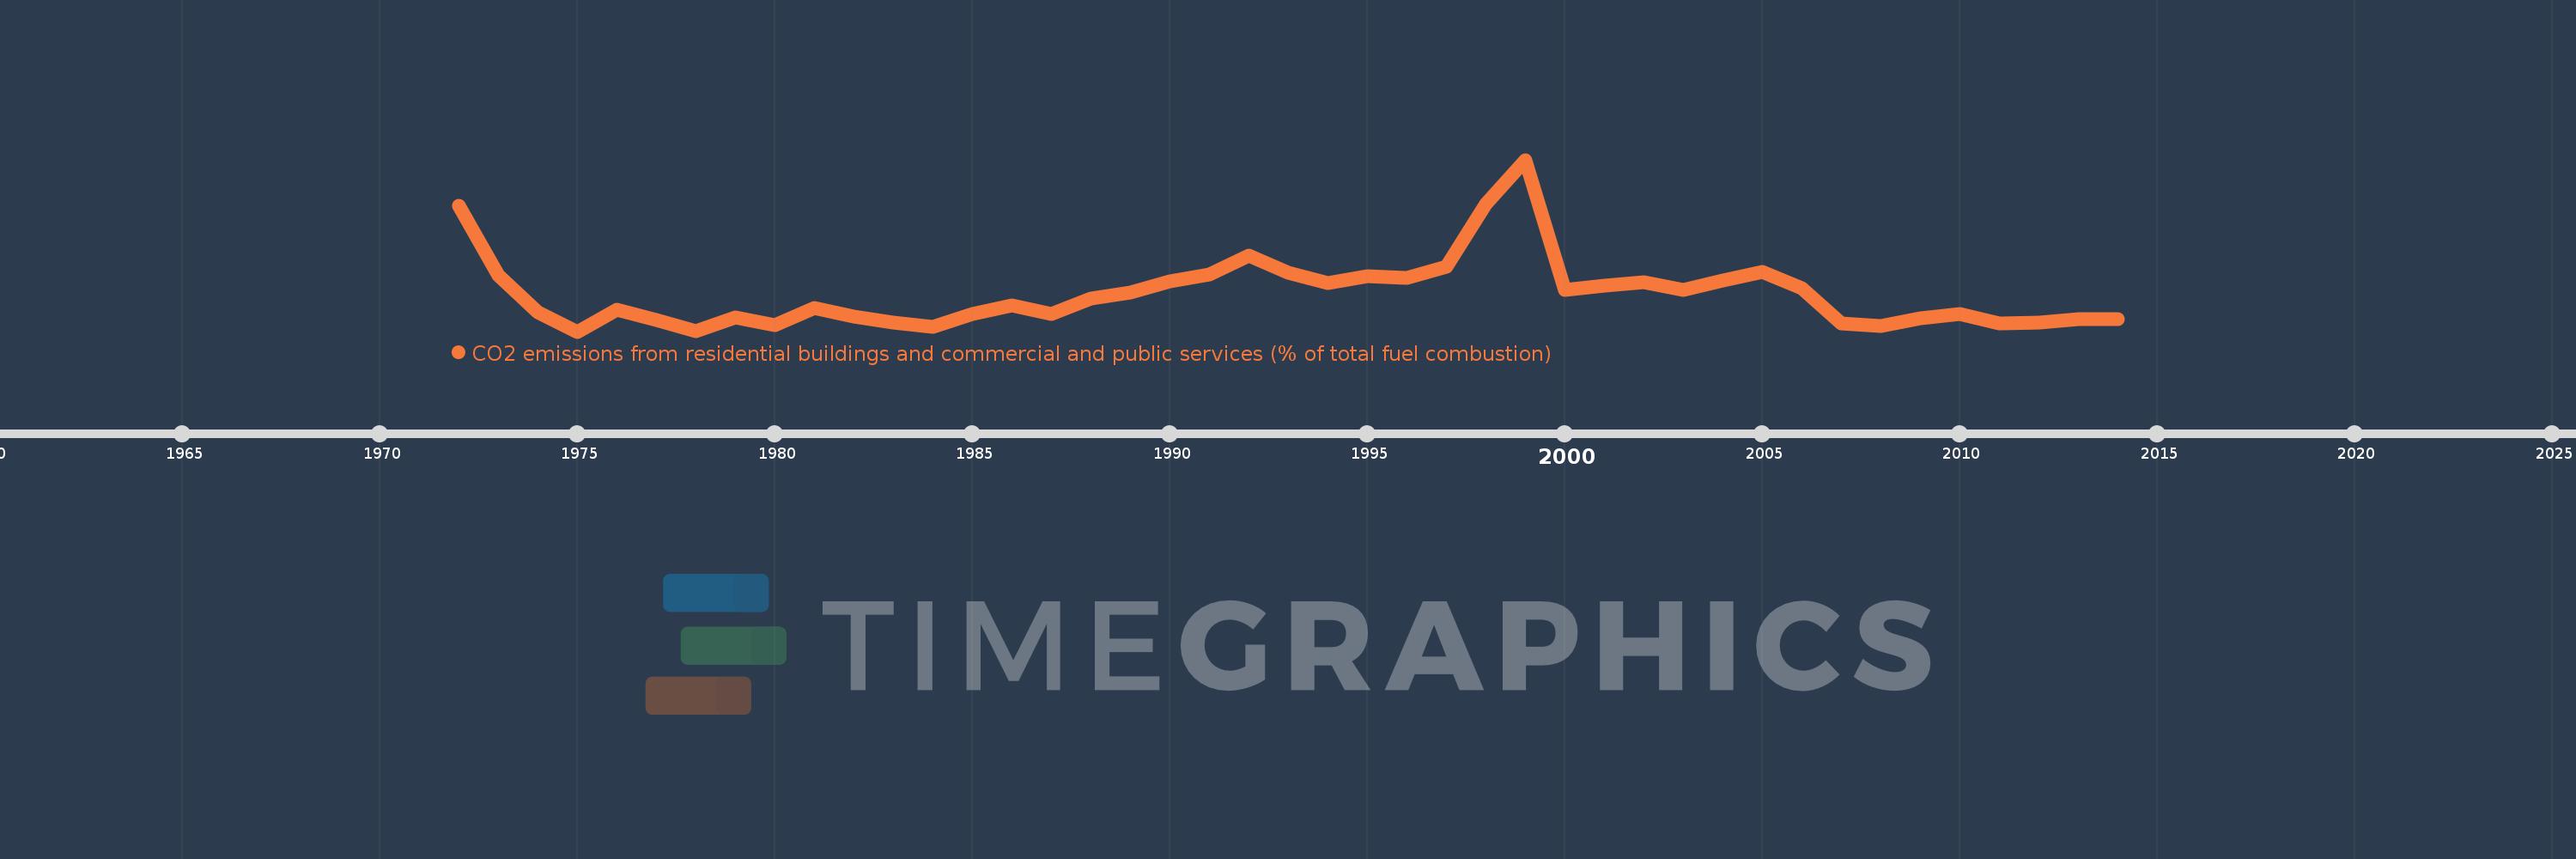
CO2 emissions from residential buildings and commercial and public services (% of total fuel combustion)
2014,2013,2012,2011,2010,2009,2008,2007,2006,2005,2004,2003,2002,2001,2000,1999,1998,1997,1996,1995,1994,1993,1992,1991,1990,1989,1988,1987,1986,1985,1984,1983,1982,1981,1980,1979,1978,1977,1976,1975,1974,1973,1972
This statistics in other country:
AlbaniaAlgeriaAngolaArab WorldArgentinaArmeniaAustraliaAustriaAzerbaijanBahrainBangladeshBelarusBelgiumBeninBoliviaBosnia and HerzegovinaBotswanaBrazilBrunei DarussalamBulgariaCambodiaCameroonCanadaCaribbean small statesCentral Europe and the BalticsChileChinaColombiaCongo, Dem. Rep.Congo, Rep.Costa RicaCote d'IvoireCroatiaCubaCuracaoCyprusCzech RepublicDenmarkDominican RepublicEarly-demographic dividendEast Asia & PacificEast Asia & Pacific (excluding high income)East Asia & Pacific (IDA & IBRD countries)EcuadorEgypt, Arab Rep.El SalvadorEritreaEstoniaEthiopiaEuro areaEurope & Central AsiaEurope & Central Asia (excluding high income)Europe & Central Asia (IDA & IBRD countries)European UnionFinlandFragile and conflict affected situationsFranceGabonGeorgiaGermanyGhanaGibraltarGreeceGuatemalaHaitiHeavily indebted poor countries (HIPC)High incomeHondurasHong Kong SAR, ChinaHungaryIBRD onlyIcelandIDA & IBRD totalIDA blendIDA onlyIDA totalIndiaIndonesiaIran, Islamic Rep.IraqIrelandIsraelItalyJamaicaJapanJordanKazakhstanKenyaKorea, Dem. People’s Rep.Korea, Rep.KosovoKuwaitKyrgyz RepublicLate-demographic dividendLatin America & Caribbean Latin America & Caribbean (excluding high income)Latin America & the Caribbean (IDA & IBRD countries)LatviaLeast developed countries: UN classificationLebanonLibyaLithuaniaLow & middle incomeLow incomeLower middle incomeLuxembourgMacedonia, FYRMalaysiaMaltaMauritiusMexicoMiddle East & North AfricaMiddle East & North Africa (excluding high income)Middle East & North Africa (IDA & IBRD countries)Middle incomeMoldovaMongoliaMontenegroMoroccoMozambiqueMyanmarNamibiaNepalNetherlandsNew ZealandNicaraguaNigerNigeriaNorth AmericaNorwayOECD membersOmanOther small statesPakistanPanamaParaguayPeruPhilippinesPolandPortugalPost-demographic dividendPre-demographic dividendQatarRomaniaRussian FederationSaudi ArabiaSenegalSerbiaSingaporeSlovak RepublicSloveniaSmall statesSouth AfricaSouth AsiaSouth Asia (IDA & IBRD)South SudanSpainSri LankaSub-Saharan Africa Sub-Saharan Africa (excluding high income)Sub-Saharan Africa (IDA & IBRD countries)SudanSwedenSwitzerlandSyrian Arab RepublicTajikistanTanzaniaThailandTogoTrinidad and TobagoTunisiaTurkeyTurkmenistanUkraineUnited Arab EmiratesUnited KingdomUnited StatesUpper middle incomeUruguayUzbekistanVenezuela, RBVietnamWorldYemen, Rep.ZambiaZimbabwe Timeline:
This timeline shows a graph from 1972 to 2014 of Bahrain. No data until 1971. Number of actual observations by date: 43.
Source name:
World Development Indicators
Source organization:
IEA Statistics © OECD/IEA 2014 (http://www.iea.org/stats/index.asp), subject to https://www.iea.org/t&c/termsandconditions/
Categories, topics:
Environment
Last updated:
apr 23, 2017
Indicators value changes by year
At the date of observation
Value
Absolute change
Change from previous value
jan 1, 1972
1.73
+1.73
0.0%
jan 1, 1973
1.212
-0.518
-29.94%
jan 1, 1974
0.937
-0.275
-22.72%
jan 1, 1975
0.792
-0.145
-15.45%
jan 1, 1976
0.956
+0.164
20.7%
jan 1, 1977
0.88
-0.076
-7.92%
jan 1, 1978
0.794
-0.087
-9.84%
jan 1, 1979
0.898
+0.105
13.17%
jan 1, 1980
0.84
-0.058
-6.44%
jan 1, 1981
0.967
+0.127
15.06%
jan 1, 1982
0.902
-0.065
-6.7%
jan 1, 1983
0.86
-0.042
-4.67%
jan 1, 1984
0.827
-0.033
-3.78%
jan 1, 1985
0.924
+0.096
11.65%
jan 1, 1986
0.989
+0.065
7.06%
jan 1, 1987
0.921
-0.068
-6.86%
jan 1, 1988
1.04
+0.118
12.84%
jan 1, 1989
1.087
+0.047
4.57%
jan 1, 1990
1.17
+0.083
7.6%
jan 1, 1991
1.217
+0.048
4.07%
jan 1, 1992
1.362
+0.145
11.88%
jan 1, 1993
1.232
-0.13
-9.57%
jan 1, 1994
1.157
-0.075
-6.09%
jan 1, 1995
1.205
+0.048
4.18%
jan 1, 1996
1.19
-0.015
-1.26%
jan 1, 1997
1.278
+0.088
7.39%
jan 1, 1998
1.743
+0.466
36.47%
jan 1, 1999
2.075
+0.332
19.04%
jan 1, 2000
1.105
-0.971
-46.77%
jan 1, 2001
1.136
+0.032
2.87%
jan 1, 2002
1.162
+0.026
2.26%
jan 1, 2003
1.105
-0.057
-4.89%
jan 1, 2004
1.173
+0.068
6.14%
jan 1, 2005
1.237
+0.064
5.47%
jan 1, 2006
1.119
-0.119
-9.59%
jan 1, 2007
0.85
-0.269
-24.01%
jan 1, 2008
0.831
-0.019
-2.23%
jan 1, 2009
0.894
+0.063
7.56%
jan 1, 2010
0.925
+0.031
3.49%
jan 1, 2011
0.852
-0.073
-7.87%
jan 1, 2012
0.857
+0.005
0.55%
jan 1, 2013
0.884
+0.027
3.18%
jan 1, 2014
0.883
-0.001
-0.1%
Ranking of countries by current statistics by years


Comments: