29
/
en
AIzaSyAYiBZKx7MnpbEhh9jyipgxe19OcubqV5w
April 1, 2024
40552
Late-demographic dividend
LTE
false
2
1
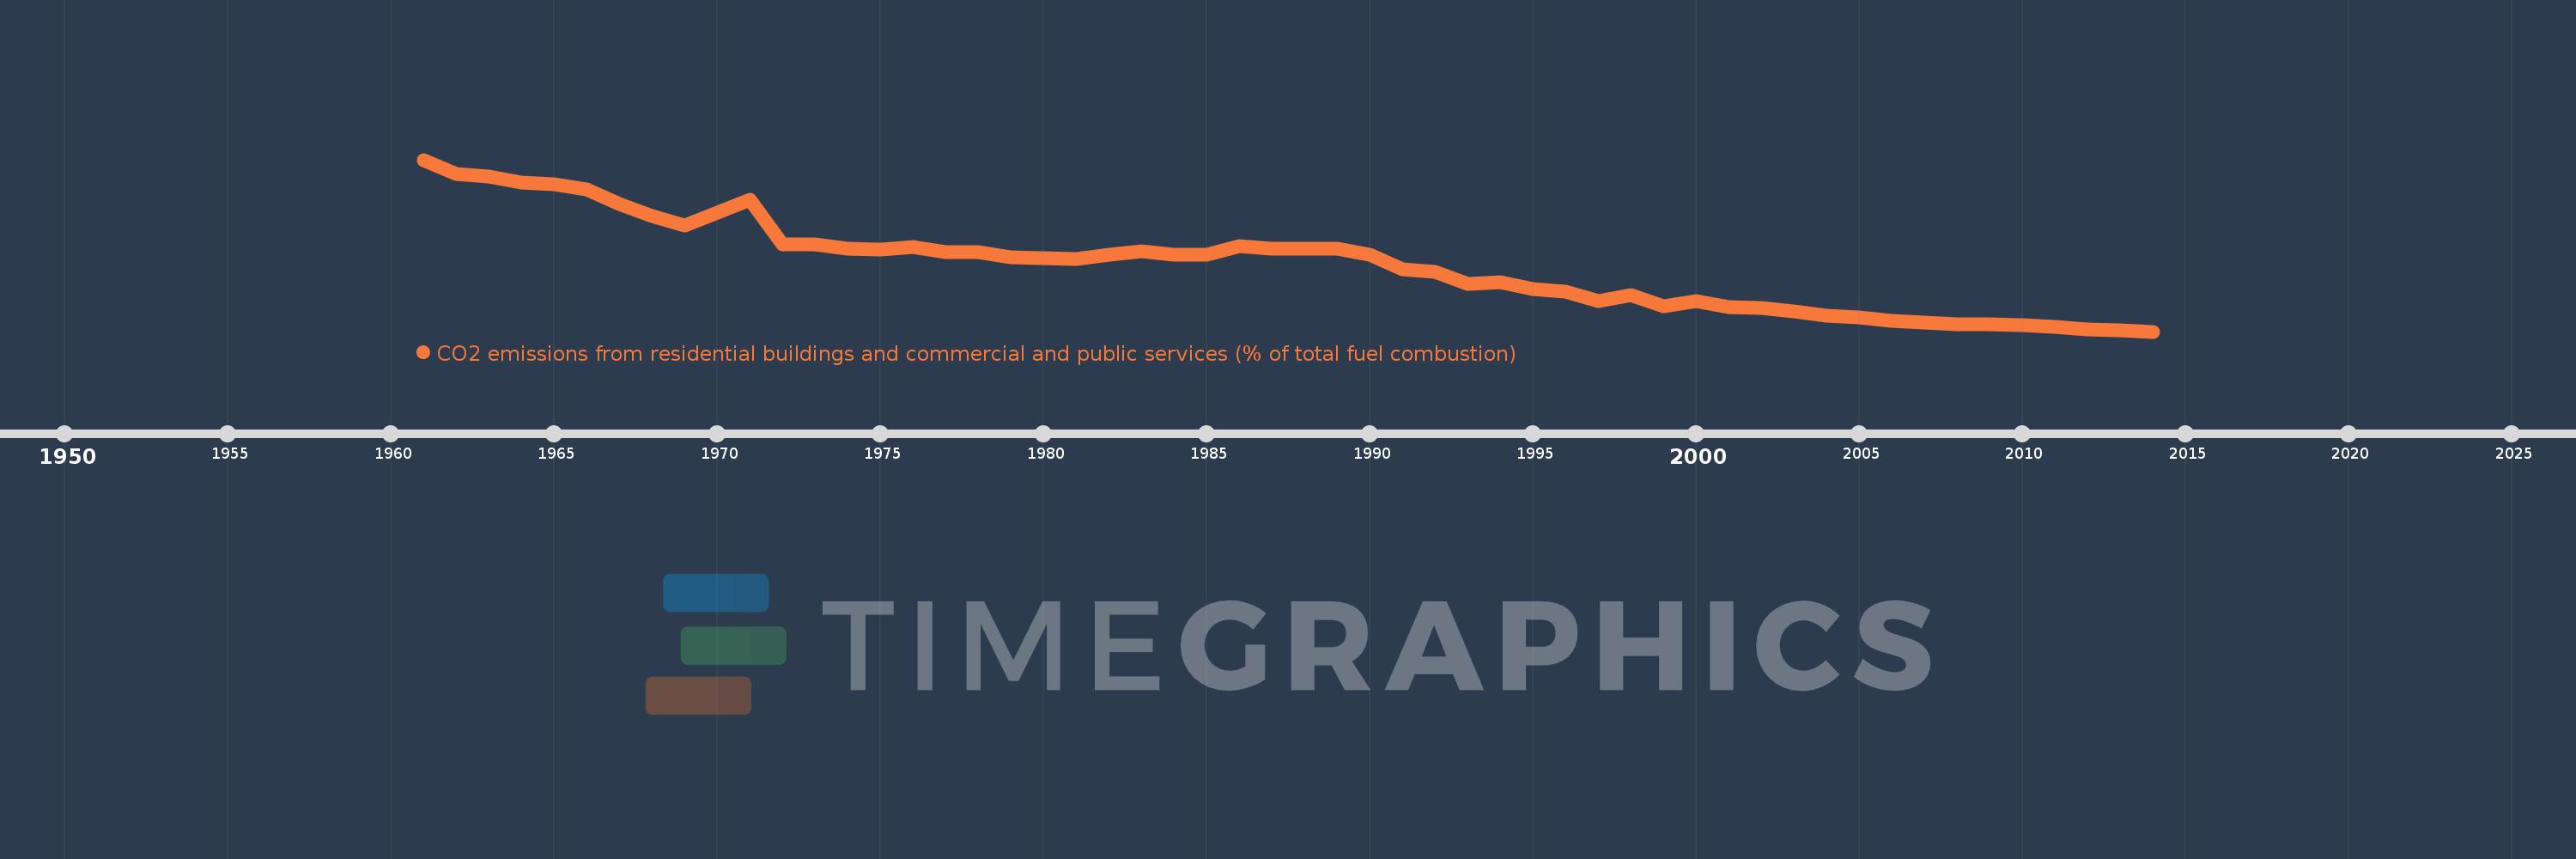
CO2 emissions from residential buildings and commercial and public services (% of total fuel combustion)
2014,2013,2012,2011,2010,2009,2008,2007,2006,2005,2004,2003,2002,2001,2000,1999,1998,1997,1996,1995,1994,1993,1992,1991,1990,1989,1988,1987,1986,1985,1984,1983,1982,1981,1980,1979,1978,1977,1976,1975,1974,1973,1972,1971,1970,1969,1968,1967,1966,1965,1964,1963,1962,1961
This statistics in other country:
AlbaniaAlgeriaAngolaArab WorldArgentinaArmeniaAustraliaAustriaAzerbaijanBahrainBangladeshBelarusBelgiumBeninBoliviaBosnia and HerzegovinaBotswanaBrazilBrunei DarussalamBulgariaCambodiaCameroonCanadaCaribbean small statesCentral Europe and the BalticsChileChinaColombiaCongo, Dem. Rep.Congo, Rep.Costa RicaCote d'IvoireCroatiaCubaCuracaoCyprusCzech RepublicDenmarkDominican RepublicEarly-demographic dividendEast Asia & PacificEast Asia & Pacific (excluding high income)East Asia & Pacific (IDA & IBRD countries)EcuadorEgypt, Arab Rep.El SalvadorEritreaEstoniaEthiopiaEuro areaEurope & Central AsiaEurope & Central Asia (excluding high income)Europe & Central Asia (IDA & IBRD countries)European UnionFinlandFragile and conflict affected situationsFranceGabonGeorgiaGermanyGhanaGibraltarGreeceGuatemalaHaitiHeavily indebted poor countries (HIPC)High incomeHondurasHong Kong SAR, ChinaHungaryIBRD onlyIcelandIDA & IBRD totalIDA blendIDA onlyIDA totalIndiaIndonesiaIran, Islamic Rep.IraqIrelandIsraelItalyJamaicaJapanJordanKazakhstanKenyaKorea, Dem. People’s Rep.Korea, Rep.KosovoKuwaitKyrgyz RepublicLate-demographic dividendLatin America & Caribbean Latin America & Caribbean (excluding high income)Latin America & the Caribbean (IDA & IBRD countries)LatviaLeast developed countries: UN classificationLebanonLibyaLithuaniaLow & middle incomeLow incomeLower middle incomeLuxembourgMacedonia, FYRMalaysiaMaltaMauritiusMexicoMiddle East & North AfricaMiddle East & North Africa (excluding high income)Middle East & North Africa (IDA & IBRD countries)Middle incomeMoldovaMongoliaMontenegroMoroccoMozambiqueMyanmarNamibiaNepalNetherlandsNew ZealandNicaraguaNigerNigeriaNorth AmericaNorwayOECD membersOmanOther small statesPakistanPanamaParaguayPeruPhilippinesPolandPortugalPost-demographic dividendPre-demographic dividendQatarRomaniaRussian FederationSaudi ArabiaSenegalSerbiaSingaporeSlovak RepublicSloveniaSmall statesSouth AfricaSouth AsiaSouth Asia (IDA & IBRD)South SudanSpainSri LankaSub-Saharan Africa Sub-Saharan Africa (excluding high income)Sub-Saharan Africa (IDA & IBRD countries)SudanSwedenSwitzerlandSyrian Arab RepublicTajikistanTanzaniaThailandTogoTrinidad and TobagoTunisiaTurkeyTurkmenistanUkraineUnited Arab EmiratesUnited KingdomUnited StatesUpper middle incomeUruguayUzbekistanVenezuela, RBVietnamWorldYemen, Rep.ZambiaZimbabwe Timeline:
This timeline shows a graph from 1961 to 2014 of Late-demographic dividend. No data until 1960. Number of actual observations by date: 54.
Source name:
World Development Indicators
Source organization:
IEA Statistics © OECD/IEA 2014 (http://www.iea.org/stats/index.asp), subject to https://www.iea.org/t&c/termsandconditions/
Categories, topics:
Environment
Last updated:
apr 23, 2017
Indicators value changes by year
Maximum:
25.483
jan 1, 1961
At the date of observation
Value
Absolute change
Change from previous value
jan 1, 1961
25.483
+25.483
0.0%
jan 1, 1962
23.873
-1.61
-6.32%
jan 1, 1963
23.581
-0.292
-1.22%
jan 1, 1964
22.877
-0.704
-2.99%
jan 1, 1965
22.641
-0.235
-1.03%
jan 1, 1966
22.1
-0.542
-2.39%
jan 1, 1967
20.407
-1.693
-7.66%
jan 1, 1968
19.077
-1.331
-6.52%
jan 1, 1969
17.954
-1.122
-5.88%
jan 1, 1970
19.423
+1.468
8.18%
jan 1, 1971
20.947
+1.524
7.85%
jan 1, 1972
15.757
-5.19
-24.78%
jan 1, 1973
15.764
+0.008
0.05%
jan 1, 1974
15.335
-0.429
-2.72%
jan 1, 1975
15.177
-0.158
-1.03%
jan 1, 1976
15.506
+0.329
2.16%
jan 1, 1977
14.947
-0.558
-3.6%
jan 1, 1978
14.882
-0.065
-0.44%
jan 1, 1979
14.299
-0.583
-3.92%
jan 1, 1980
14.198
-0.101
-0.71%
jan 1, 1981
14.145
-0.053
-0.37%
jan 1, 1982
14.647
+0.502
3.55%
jan 1, 1983
15.011
+0.364
2.49%
jan 1, 1984
14.655
-0.356
-2.37%
jan 1, 1985
14.581
-0.074
-0.5%
jan 1, 1986
15.566
+0.985
6.76%
jan 1, 1987
15.309
-0.257
-1.65%
jan 1, 1988
15.274
-0.035
-0.23%
jan 1, 1989
15.321
+0.047
0.31%
jan 1, 1990
14.569
-0.753
-4.91%
jan 1, 1991
12.931
-1.638
-11.24%
jan 1, 1992
12.654
-0.277
-2.14%
jan 1, 1993
11.308
-1.346
-10.64%
jan 1, 1994
11.473
+0.165
1.46%
jan 1, 1995
10.718
-0.755
-6.58%
jan 1, 1996
10.382
-0.335
-3.13%
jan 1, 1997
9.302
-1.081
-10.41%
jan 1, 1998
9.965
+0.663
7.13%
jan 1, 1999
8.738
-1.227
-12.32%
jan 1, 2000
9.262
+0.524
6.0%
jan 1, 2001
8.61
-0.652
-7.04%
jan 1, 2002
8.518
-0.092
-1.06%
jan 1, 2003
8.079
-0.439
-5.16%
jan 1, 2004
7.64
-0.439
-5.43%
jan 1, 2005
7.41
-0.23
-3.01%
jan 1, 2006
7.053
-0.357
-4.82%
jan 1, 2007
6.851
-0.202
-2.87%
jan 1, 2008
6.69
-0.161
-2.35%
jan 1, 2009
6.657
-0.033
-0.49%
jan 1, 2010
6.528
-0.129
-1.94%
jan 1, 2011
6.35
-0.178
-2.73%
jan 1, 2012
6.021
-0.329
-5.18%
jan 1, 2013
5.94
-0.081
-1.35%
jan 1, 2014
5.811
-0.129
-2.16%
Ranking of countries by current statistics by years


Comments: