29
/
en
AIzaSyAYiBZKx7MnpbEhh9jyipgxe19OcubqV5w
April 1, 2024
210119
Nicaragua
NIC
true
2
1
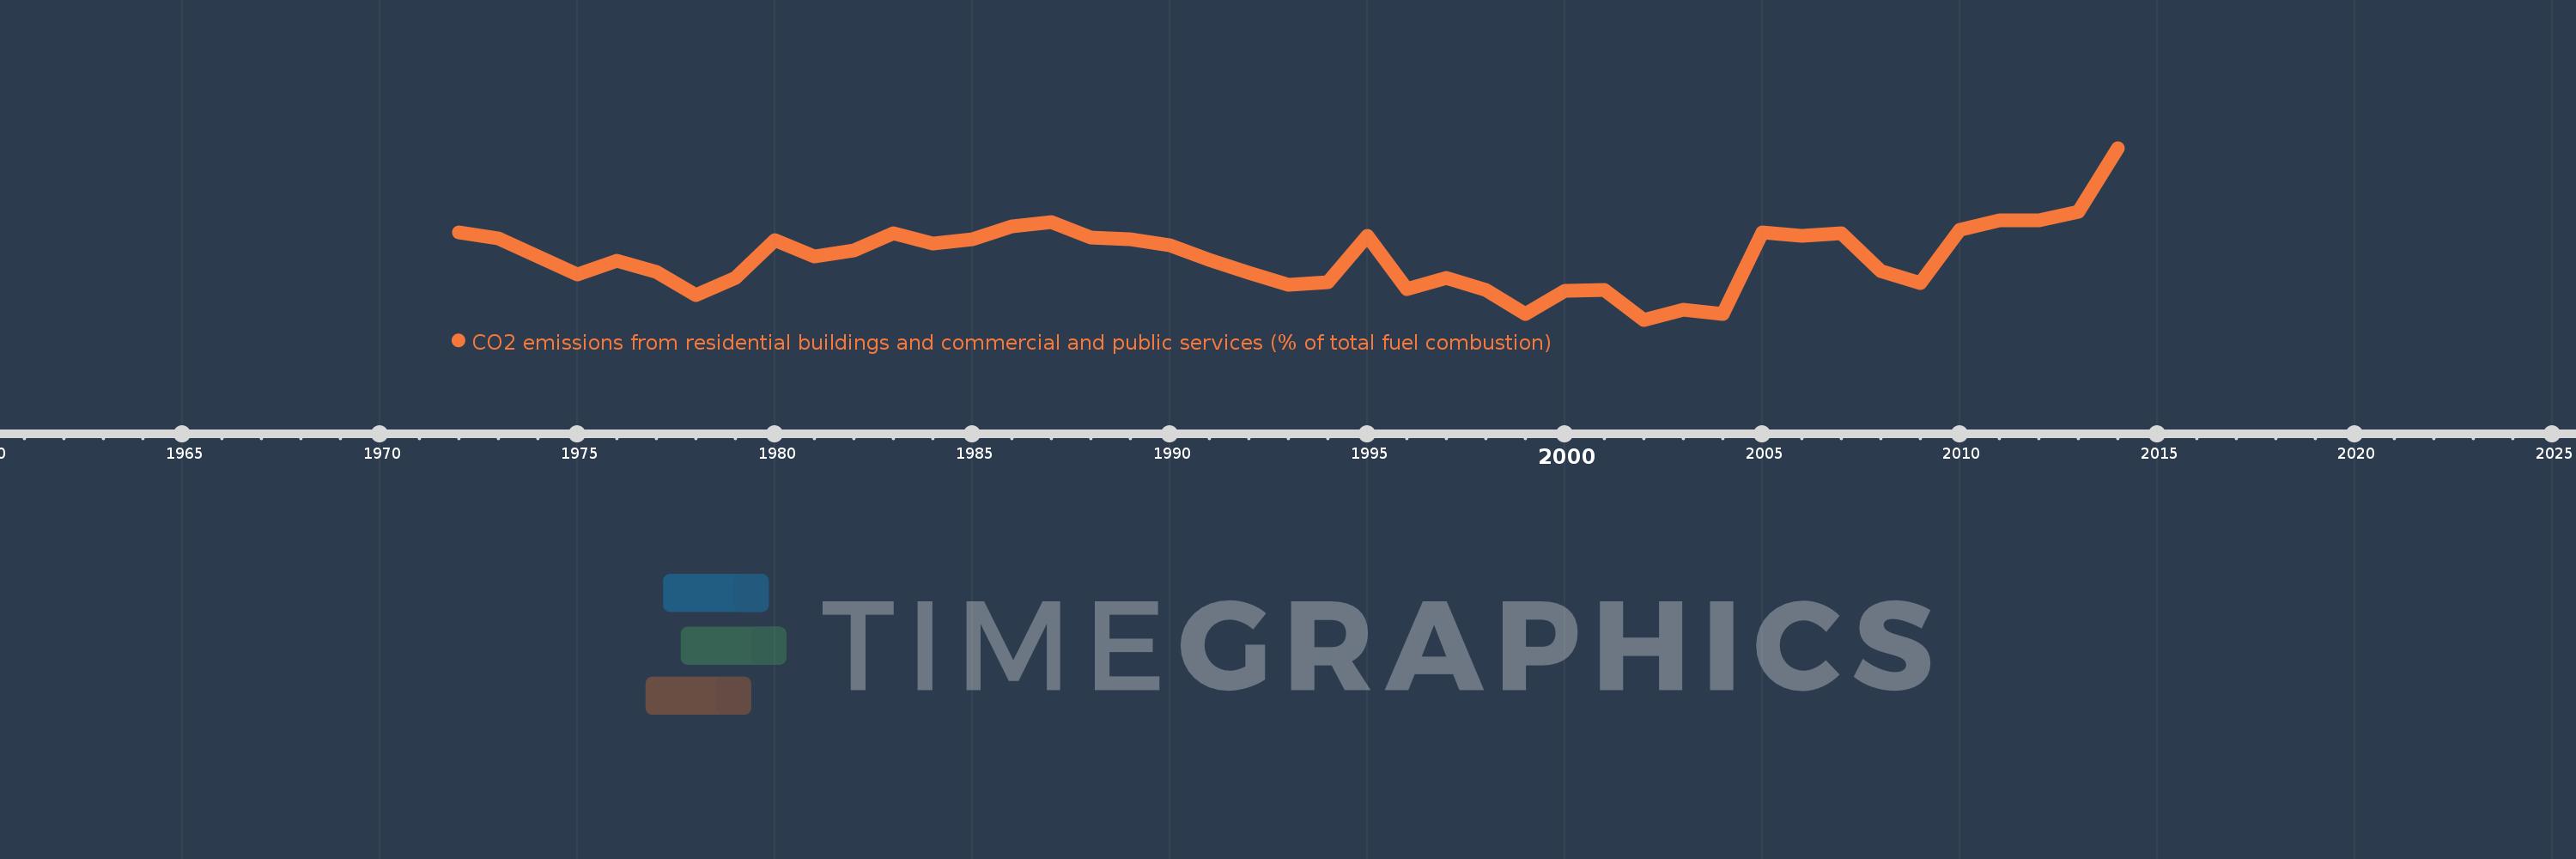
CO2 emissions from residential buildings and commercial and public services (% of total fuel combustion)
2014,2013,2012,2011,2010,2009,2008,2007,2006,2005,2004,2003,2002,2001,2000,1999,1998,1997,1996,1995,1994,1993,1992,1991,1990,1989,1988,1987,1986,1985,1984,1983,1982,1981,1980,1979,1978,1977,1976,1975,1974,1973,1972
This statistics in other country:
AlbaniaAlgeriaAngolaArab WorldArgentinaArmeniaAustraliaAustriaAzerbaijanBahrainBangladeshBelarusBelgiumBeninBoliviaBosnia and HerzegovinaBotswanaBrazilBrunei DarussalamBulgariaCambodiaCameroonCanadaCaribbean small statesCentral Europe and the BalticsChileChinaColombiaCongo, Dem. Rep.Congo, Rep.Costa RicaCote d'IvoireCroatiaCubaCuracaoCyprusCzech RepublicDenmarkDominican RepublicEarly-demographic dividendEast Asia & PacificEast Asia & Pacific (excluding high income)East Asia & Pacific (IDA & IBRD countries)EcuadorEgypt, Arab Rep.El SalvadorEritreaEstoniaEthiopiaEuro areaEurope & Central AsiaEurope & Central Asia (excluding high income)Europe & Central Asia (IDA & IBRD countries)European UnionFinlandFragile and conflict affected situationsFranceGabonGeorgiaGermanyGhanaGibraltarGreeceGuatemalaHaitiHeavily indebted poor countries (HIPC)High incomeHondurasHong Kong SAR, ChinaHungaryIBRD onlyIcelandIDA & IBRD totalIDA blendIDA onlyIDA totalIndiaIndonesiaIran, Islamic Rep.IraqIrelandIsraelItalyJamaicaJapanJordanKazakhstanKenyaKorea, Dem. People’s Rep.Korea, Rep.KosovoKuwaitKyrgyz RepublicLate-demographic dividendLatin America & Caribbean Latin America & Caribbean (excluding high income)Latin America & the Caribbean (IDA & IBRD countries)LatviaLeast developed countries: UN classificationLebanonLibyaLithuaniaLow & middle incomeLow incomeLower middle incomeLuxembourgMacedonia, FYRMalaysiaMaltaMauritiusMexicoMiddle East & North AfricaMiddle East & North Africa (excluding high income)Middle East & North Africa (IDA & IBRD countries)Middle incomeMoldovaMongoliaMontenegroMoroccoMozambiqueMyanmarNamibiaNepalNetherlandsNew ZealandNicaraguaNigerNigeriaNorth AmericaNorwayOECD membersOmanOther small statesPakistanPanamaParaguayPeruPhilippinesPolandPortugalPost-demographic dividendPre-demographic dividendQatarRomaniaRussian FederationSaudi ArabiaSenegalSerbiaSingaporeSlovak RepublicSloveniaSmall statesSouth AfricaSouth AsiaSouth Asia (IDA & IBRD)South SudanSpainSri LankaSub-Saharan Africa Sub-Saharan Africa (excluding high income)Sub-Saharan Africa (IDA & IBRD countries)SudanSwedenSwitzerlandSyrian Arab RepublicTajikistanTanzaniaThailandTogoTrinidad and TobagoTunisiaTurkeyTurkmenistanUkraineUnited Arab EmiratesUnited KingdomUnited StatesUpper middle incomeUruguayUzbekistanVenezuela, RBVietnamWorldYemen, Rep.ZambiaZimbabwe Timeline:
This timeline shows a graph from 1972 to 2014 of Nicaragua. No data until 1971. Number of actual observations by date: 43.
Source name:
World Development Indicators
Source organization:
IEA Statistics © OECD/IEA 2014 (http://www.iea.org/stats/index.asp), subject to https://www.iea.org/t&c/termsandconditions/
Categories, topics:
Environment
Last updated:
apr 23, 2017
Indicators value changes by year
Maximum:
11.164
jan 1, 2014
At the date of observation
Value
Absolute change
Change from previous value
jan 1, 1972
8.054
+8.054
0.0%
jan 1, 1973
7.843
-0.211
-2.61%
jan 1, 1974
7.186
-0.658
-8.38%
jan 1, 1975
6.522
-0.664
-9.24%
jan 1, 1976
7.027
+0.505
7.75%
jan 1, 1977
6.604
-0.423
-6.02%
jan 1, 1978
5.747
-0.857
-12.97%
jan 1, 1979
6.383
+0.636
11.06%
jan 1, 1980
7.792
+1.409
22.08%
jan 1, 1981
7.182
-0.61
-7.83%
jan 1, 1982
7.407
+0.225
3.13%
jan 1, 1983
8.021
+0.614
8.29%
jan 1, 1984
7.653
-0.368
-4.59%
jan 1, 1985
7.821
+0.168
2.2%
jan 1, 1986
8.287
+0.466
5.96%
jan 1, 1987
8.451
+0.163
1.97%
jan 1, 1988
7.87
-0.58
-6.87%
jan 1, 1989
7.813
-0.058
-0.74%
jan 1, 1990
7.602
-0.21
-2.69%
jan 1, 1991
7.065
-0.537
-7.07%
jan 1, 1992
6.593
-0.472
-6.68%
jan 1, 1993
6.132
-0.461
-7.0%
jan 1, 1994
6.22
+0.088
1.44%
jan 1, 1995
7.95
+1.73
27.81%
jan 1, 1996
5.976
-1.974
-24.83%
jan 1, 1997
6.391
+0.415
6.94%
jan 1, 1998
5.944
-0.447
-6.99%
jan 1, 1999
5.06
-0.885
-14.88%
jan 1, 2000
5.9
+0.84
16.61%
jan 1, 2001
5.932
+0.032
0.55%
jan 1, 2002
4.852
-1.08
-18.21%
jan 1, 2003
5.222
+0.37
7.63%
jan 1, 2004
5.063
-0.159
-3.04%
jan 1, 2005
8.049
+2.985
58.96%
jan 1, 2006
7.94
-0.108
-1.35%
jan 1, 2007
8.019
+0.078
0.99%
jan 1, 2008
6.651
-1.367
-17.05%
jan 1, 2009
6.205
-0.446
-6.71%
jan 1, 2010
8.153
+1.948
31.4%
jan 1, 2011
8.506
+0.352
4.32%
jan 1, 2012
8.501
-0.005
-0.05%
jan 1, 2013
8.804
+0.302
3.56%
jan 1, 2014
11.164
+2.36
26.81%
Ranking of countries by current statistics by years


Comments: