29
/
en
AIzaSyAYiBZKx7MnpbEhh9jyipgxe19OcubqV5w
April 1, 2024
30520
Europe & Central Asia
ECS
false
2
1
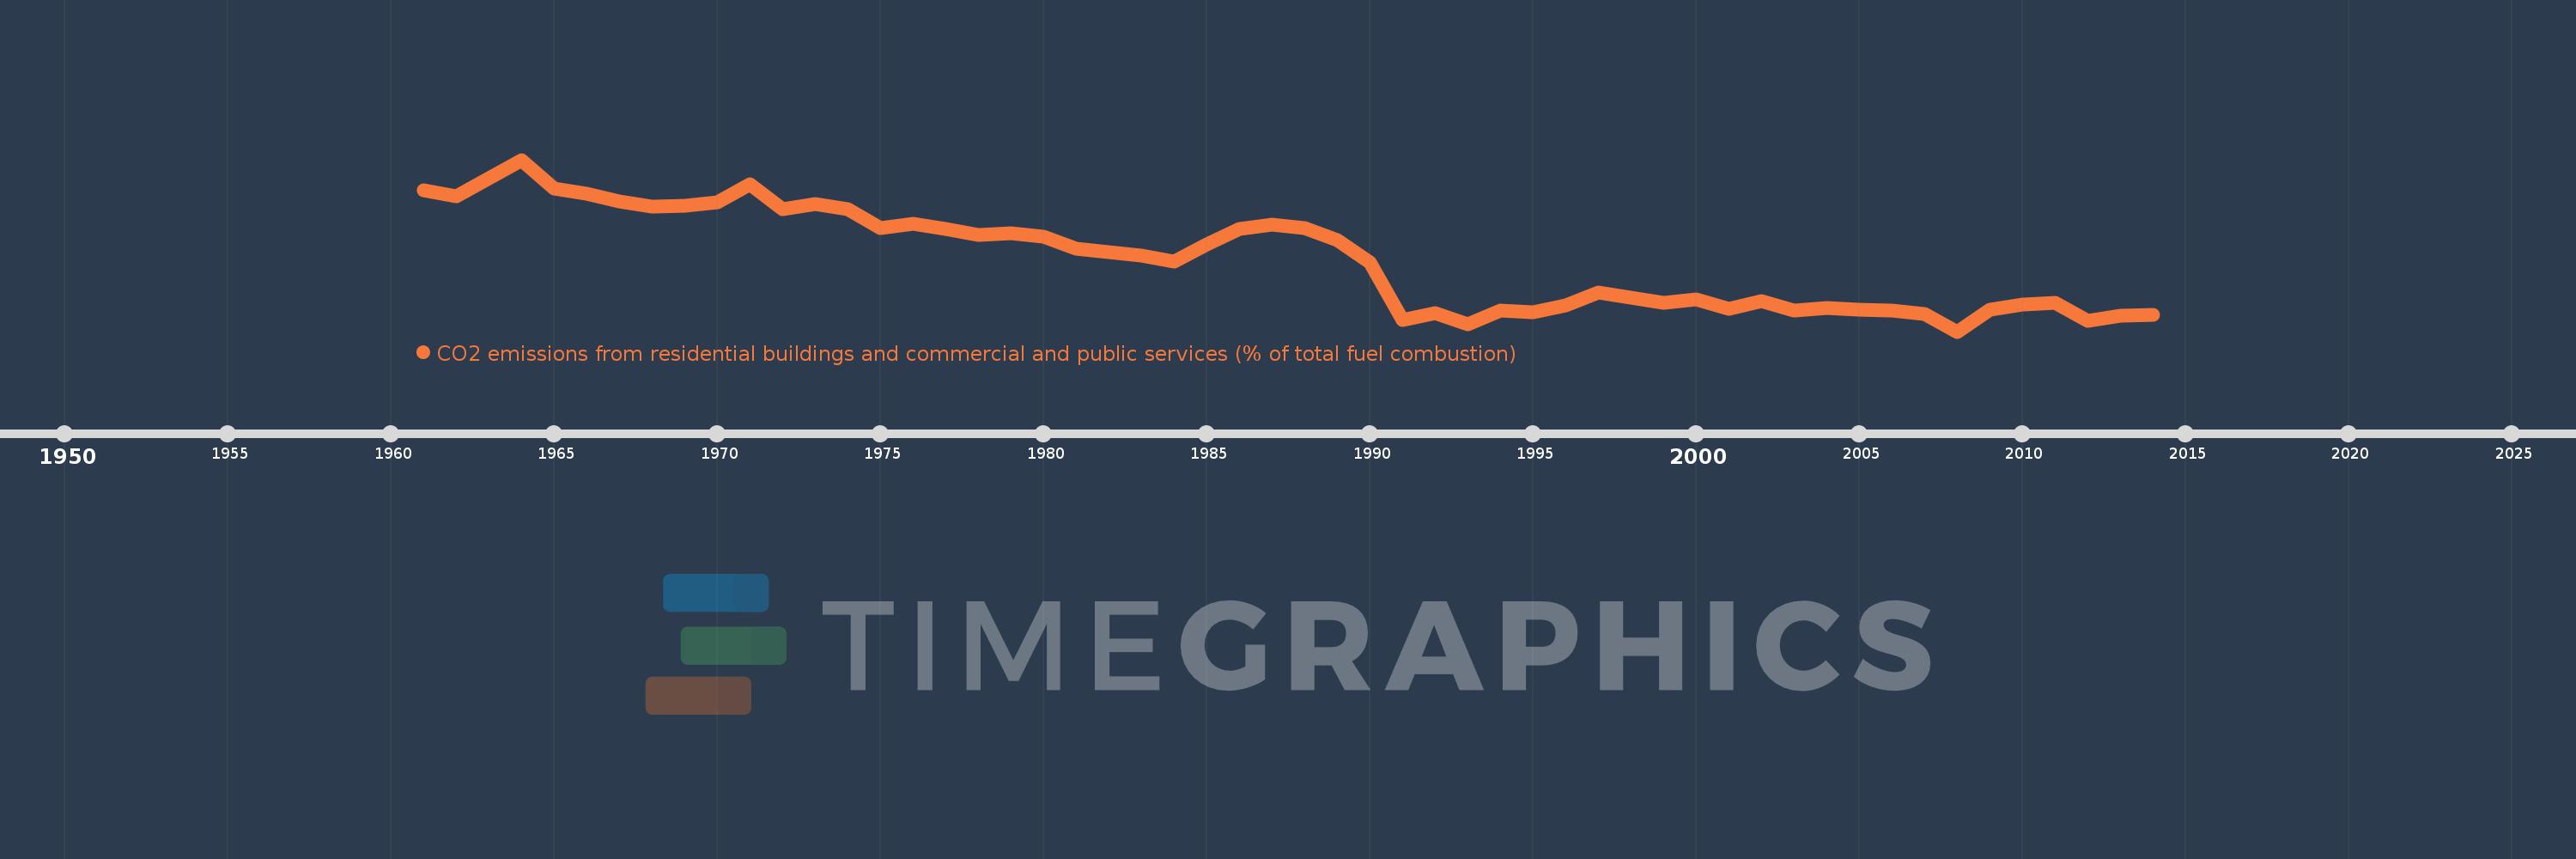
CO2 emissions from residential buildings and commercial and public services (% of total fuel combustion)
2014,2013,2012,2011,2010,2009,2008,2007,2006,2005,2004,2003,2002,2001,2000,1999,1998,1997,1996,1995,1994,1993,1992,1991,1990,1989,1988,1987,1986,1985,1984,1983,1982,1981,1980,1979,1978,1977,1976,1975,1974,1973,1972,1971,1970,1969,1968,1967,1966,1965,1964,1963,1962,1961
This statistics in other country:
AlbaniaAlgeriaAngolaArab WorldArgentinaArmeniaAustraliaAustriaAzerbaijanBahrainBangladeshBelarusBelgiumBeninBoliviaBosnia and HerzegovinaBotswanaBrazilBrunei DarussalamBulgariaCambodiaCameroonCanadaCaribbean small statesCentral Europe and the BalticsChileChinaColombiaCongo, Dem. Rep.Congo, Rep.Costa RicaCote d'IvoireCroatiaCubaCuracaoCyprusCzech RepublicDenmarkDominican RepublicEarly-demographic dividendEast Asia & PacificEast Asia & Pacific (excluding high income)East Asia & Pacific (IDA & IBRD countries)EcuadorEgypt, Arab Rep.El SalvadorEritreaEstoniaEthiopiaEuro areaEurope & Central AsiaEurope & Central Asia (excluding high income)Europe & Central Asia (IDA & IBRD countries)European UnionFinlandFragile and conflict affected situationsFranceGabonGeorgiaGermanyGhanaGibraltarGreeceGuatemalaHaitiHeavily indebted poor countries (HIPC)High incomeHondurasHong Kong SAR, ChinaHungaryIBRD onlyIcelandIDA & IBRD totalIDA blendIDA onlyIDA totalIndiaIndonesiaIran, Islamic Rep.IraqIrelandIsraelItalyJamaicaJapanJordanKazakhstanKenyaKorea, Dem. People’s Rep.Korea, Rep.KosovoKuwaitKyrgyz RepublicLate-demographic dividendLatin America & Caribbean Latin America & Caribbean (excluding high income)Latin America & the Caribbean (IDA & IBRD countries)LatviaLeast developed countries: UN classificationLebanonLibyaLithuaniaLow & middle incomeLow incomeLower middle incomeLuxembourgMacedonia, FYRMalaysiaMaltaMauritiusMexicoMiddle East & North AfricaMiddle East & North Africa (excluding high income)Middle East & North Africa (IDA & IBRD countries)Middle incomeMoldovaMongoliaMontenegroMoroccoMozambiqueMyanmarNamibiaNepalNetherlandsNew ZealandNicaraguaNigerNigeriaNorth AmericaNorwayOECD membersOmanOther small statesPakistanPanamaParaguayPeruPhilippinesPolandPortugalPost-demographic dividendPre-demographic dividendQatarRomaniaRussian FederationSaudi ArabiaSenegalSerbiaSingaporeSlovak RepublicSloveniaSmall statesSouth AfricaSouth AsiaSouth Asia (IDA & IBRD)South SudanSpainSri LankaSub-Saharan Africa Sub-Saharan Africa (excluding high income)Sub-Saharan Africa (IDA & IBRD countries)SudanSwedenSwitzerlandSyrian Arab RepublicTajikistanTanzaniaThailandTogoTrinidad and TobagoTunisiaTurkeyTurkmenistanUkraineUnited Arab EmiratesUnited KingdomUnited StatesUpper middle incomeUruguayUzbekistanVenezuela, RBVietnamWorldYemen, Rep.ZambiaZimbabwe Timeline:
This timeline shows a graph from 1961 to 2014 of Europe & Central Asia. No data until 1960. Number of actual observations by date: 54.
Source name:
World Development Indicators
Source organization:
IEA Statistics © OECD/IEA 2014 (http://www.iea.org/stats/index.asp), subject to https://www.iea.org/t&c/termsandconditions/
Categories, topics:
Environment
Last updated:
apr 23, 2017
Indicators value changes by year
Minimum:
13.535
jan 1, 2008
Maximum:
24.534
jan 1, 1964
At the date of observation
Value
Absolute change
Change from previous value
jan 1, 1961
22.596
+22.596
0.0%
jan 1, 1962
22.183
-0.413
-1.83%
jan 1, 1963
23.362
+1.179
5.32%
jan 1, 1964
24.534
+1.172
5.02%
jan 1, 1965
22.7
-1.834
-7.47%
jan 1, 1966
22.368
-0.332
-1.46%
jan 1, 1967
21.864
-0.504
-2.25%
jan 1, 1968
21.544
-0.32
-1.46%
jan 1, 1969
21.603
+0.06
0.28%
jan 1, 1970
21.809
+0.206
0.95%
jan 1, 1971
22.942
+1.133
5.2%
jan 1, 1972
21.355
-1.587
-6.92%
jan 1, 1973
21.685
+0.33
1.54%
jan 1, 1974
21.385
-0.3
-1.38%
jan 1, 1975
20.148
-1.237
-5.78%
jan 1, 1976
20.444
+0.296
1.47%
jan 1, 1977
20.104
-0.34
-1.66%
jan 1, 1978
19.701
-0.403
-2.0%
jan 1, 1979
19.826
+0.125
0.64%
jan 1, 1980
19.591
-0.236
-1.19%
jan 1, 1981
18.833
-0.758
-3.87%
jan 1, 1982
18.601
-0.233
-1.24%
jan 1, 1983
18.376
-0.224
-1.21%
jan 1, 1984
18.022
-0.355
-1.93%
jan 1, 1985
19.115
+1.093
6.06%
jan 1, 1986
20.13
+1.015
5.31%
jan 1, 1987
20.392
+0.262
1.3%
jan 1, 1988
20.146
-0.245
-1.2%
jan 1, 1989
19.371
-0.776
-3.85%
jan 1, 1990
17.949
-1.422
-7.34%
jan 1, 1991
14.295
-3.654
-20.36%
jan 1, 1992
14.691
+0.396
2.77%
jan 1, 1993
13.997
-0.694
-4.72%
jan 1, 1994
14.862
+0.865
6.18%
jan 1, 1995
14.766
-0.096
-0.65%
jan 1, 1996
15.229
+0.463
3.13%
jan 1, 1997
16.037
+0.809
5.31%
jan 1, 1998
15.699
-0.338
-2.11%
jan 1, 1999
15.368
-0.331
-2.11%
jan 1, 2000
15.613
+0.246
1.6%
jan 1, 2001
15.01
-0.603
-3.86%
jan 1, 2002
15.478
+0.468
3.12%
jan 1, 2003
14.864
-0.614
-3.97%
jan 1, 2004
15.038
+0.174
1.17%
jan 1, 2005
14.954
-0.084
-0.56%
jan 1, 2006
14.878
-0.075
-0.5%
jan 1, 2007
14.682
-0.196
-1.32%
jan 1, 2008
13.535
-1.148
-7.82%
jan 1, 2009
14.943
+1.408
10.41%
jan 1, 2010
15.282
+0.339
2.27%
jan 1, 2011
15.373
+0.091
0.6%
jan 1, 2012
14.212
-1.161
-7.55%
jan 1, 2013
14.543
+0.331
2.33%
jan 1, 2014
14.587
+0.044
0.3%
Ranking of countries by current statistics by years


Comments: