29
/
en
AIzaSyAYiBZKx7MnpbEhh9jyipgxe19OcubqV5w
April 1, 2024
133916
France
FRA
true
2
1
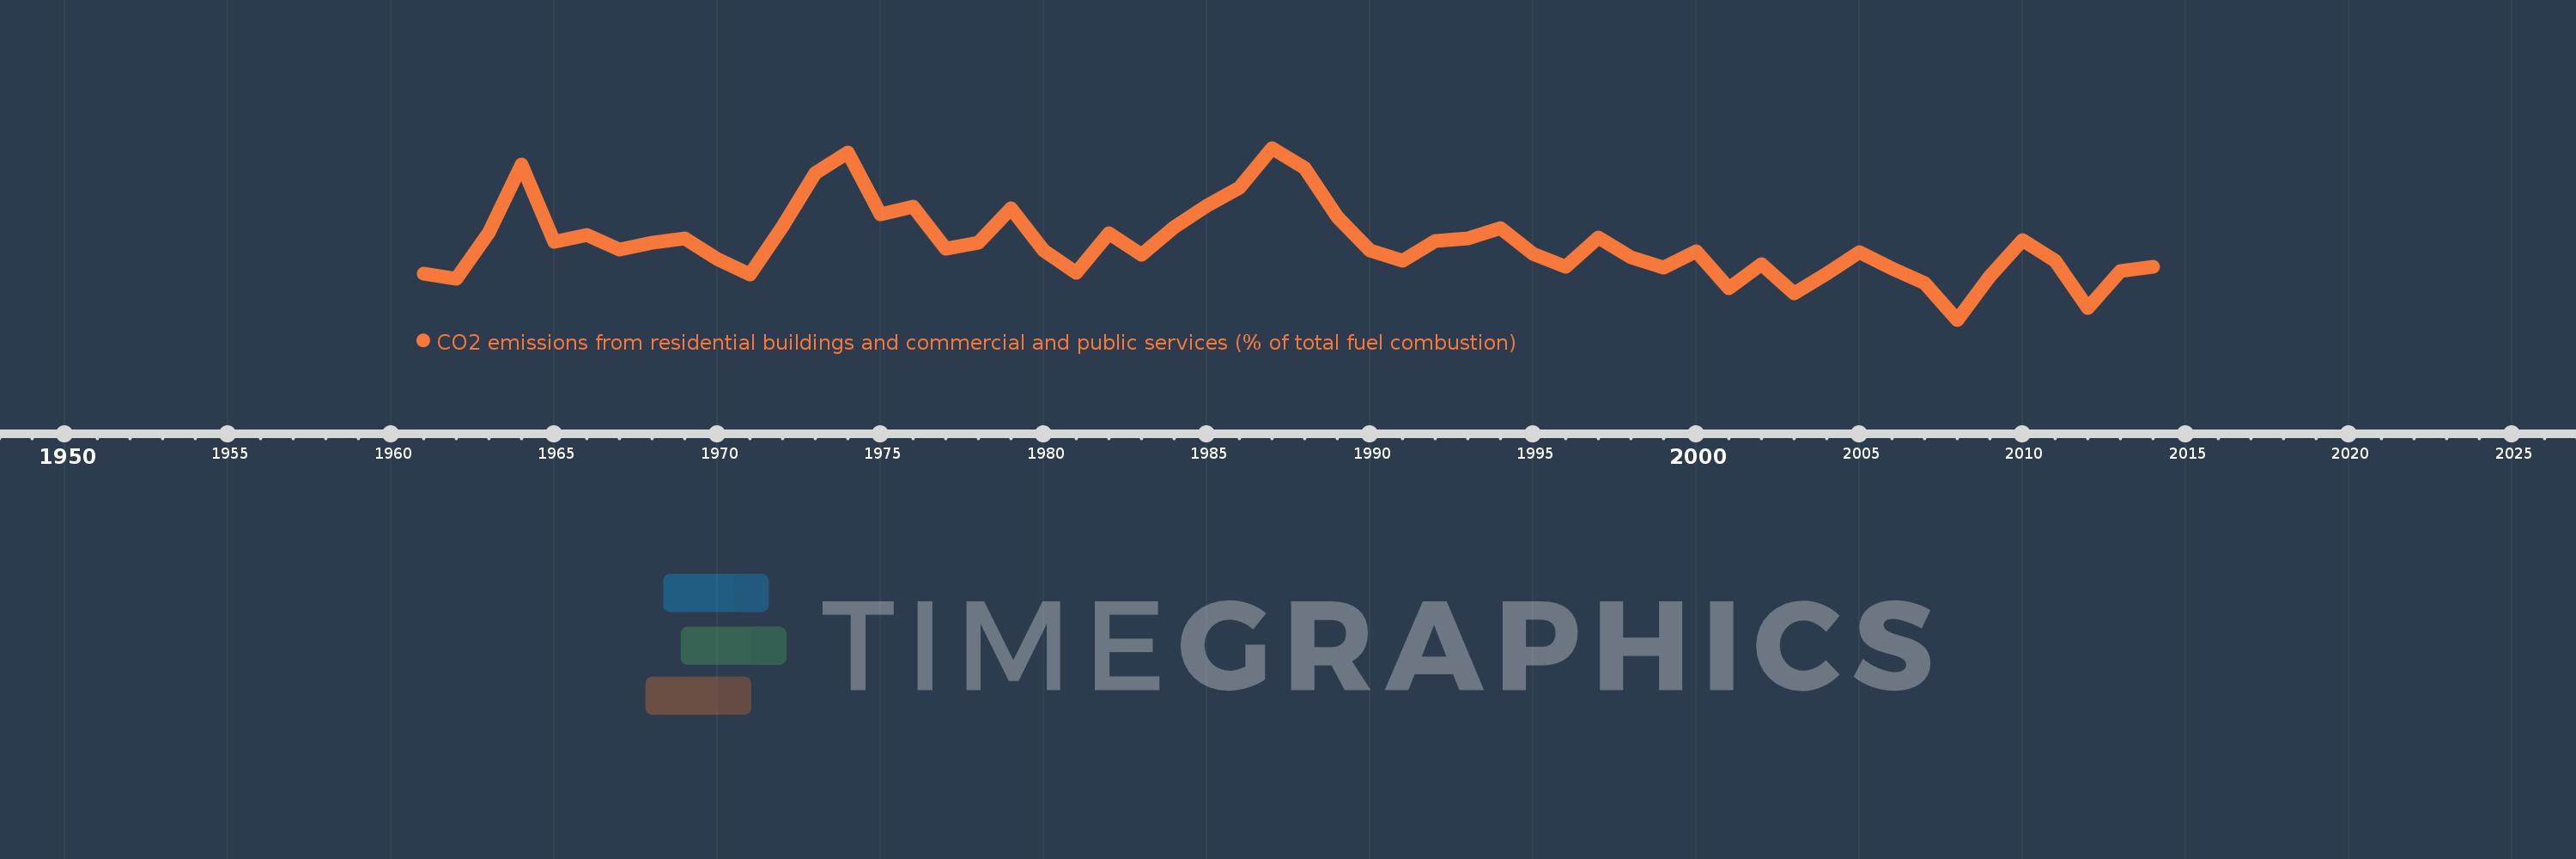
CO2 emissions from residential buildings and commercial and public services (% of total fuel combustion)
2014,2013,2012,2011,2010,2009,2008,2007,2006,2005,2004,2003,2002,2001,2000,1999,1998,1997,1996,1995,1994,1993,1992,1991,1990,1989,1988,1987,1986,1985,1984,1983,1982,1981,1980,1979,1978,1977,1976,1975,1974,1973,1972,1971,1970,1969,1968,1967,1966,1965,1964,1963,1962,1961
This statistics in other country:
AlbaniaAlgeriaAngolaArab WorldArgentinaArmeniaAustraliaAustriaAzerbaijanBahrainBangladeshBelarusBelgiumBeninBoliviaBosnia and HerzegovinaBotswanaBrazilBrunei DarussalamBulgariaCambodiaCameroonCanadaCaribbean small statesCentral Europe and the BalticsChileChinaColombiaCongo, Dem. Rep.Congo, Rep.Costa RicaCote d'IvoireCroatiaCubaCuracaoCyprusCzech RepublicDenmarkDominican RepublicEarly-demographic dividendEast Asia & PacificEast Asia & Pacific (excluding high income)East Asia & Pacific (IDA & IBRD countries)EcuadorEgypt, Arab Rep.El SalvadorEritreaEstoniaEthiopiaEuro areaEurope & Central AsiaEurope & Central Asia (excluding high income)Europe & Central Asia (IDA & IBRD countries)European UnionFinlandFragile and conflict affected situationsFranceGabonGeorgiaGermanyGhanaGibraltarGreeceGuatemalaHaitiHeavily indebted poor countries (HIPC)High incomeHondurasHong Kong SAR, ChinaHungaryIBRD onlyIcelandIDA & IBRD totalIDA blendIDA onlyIDA totalIndiaIndonesiaIran, Islamic Rep.IraqIrelandIsraelItalyJamaicaJapanJordanKazakhstanKenyaKorea, Dem. People’s Rep.Korea, Rep.KosovoKuwaitKyrgyz RepublicLate-demographic dividendLatin America & Caribbean Latin America & Caribbean (excluding high income)Latin America & the Caribbean (IDA & IBRD countries)LatviaLeast developed countries: UN classificationLebanonLibyaLithuaniaLow & middle incomeLow incomeLower middle incomeLuxembourgMacedonia, FYRMalaysiaMaltaMauritiusMexicoMiddle East & North AfricaMiddle East & North Africa (excluding high income)Middle East & North Africa (IDA & IBRD countries)Middle incomeMoldovaMongoliaMontenegroMoroccoMozambiqueMyanmarNamibiaNepalNetherlandsNew ZealandNicaraguaNigerNigeriaNorth AmericaNorwayOECD membersOmanOther small statesPakistanPanamaParaguayPeruPhilippinesPolandPortugalPost-demographic dividendPre-demographic dividendQatarRomaniaRussian FederationSaudi ArabiaSenegalSerbiaSingaporeSlovak RepublicSloveniaSmall statesSouth AfricaSouth AsiaSouth Asia (IDA & IBRD)South SudanSpainSri LankaSub-Saharan Africa Sub-Saharan Africa (excluding high income)Sub-Saharan Africa (IDA & IBRD countries)SudanSwedenSwitzerlandSyrian Arab RepublicTajikistanTanzaniaThailandTogoTrinidad and TobagoTunisiaTurkeyTurkmenistanUkraineUnited Arab EmiratesUnited KingdomUnited StatesUpper middle incomeUruguayUzbekistanVenezuela, RBVietnamWorldYemen, Rep.ZambiaZimbabwe Timeline:
This timeline shows a graph from 1961 to 2014 of France. No data until 1960. Number of actual observations by date: 54.
Source name:
World Development Indicators
Source organization:
IEA Statistics © OECD/IEA 2014 (http://www.iea.org/stats/index.asp), subject to https://www.iea.org/t&c/termsandconditions/
Categories, topics:
Environment
Last updated:
apr 23, 2017
Indicators value changes by year
Minimum:
22.006
jan 1, 2008
Maximum:
30.056
jan 1, 1987
At the date of observation
Value
Absolute change
Change from previous value
jan 1, 1961
24.162
+24.162
0.0%
jan 1, 1962
23.926
-0.236
-0.98%
jan 1, 1963
26.11
+2.184
9.13%
jan 1, 1964
29.271
+3.161
12.1%
jan 1, 1965
25.646
-3.625
-12.38%
jan 1, 1966
25.959
+0.313
1.22%
jan 1, 1967
25.281
-0.679
-2.61%
jan 1, 1968
25.618
+0.338
1.34%
jan 1, 1969
25.804
+0.186
0.72%
jan 1, 1970
24.861
-0.943
-3.65%
jan 1, 1971
24.122
-0.739
-2.97%
jan 1, 1972
26.368
+2.245
9.31%
jan 1, 1973
28.878
+2.511
9.52%
jan 1, 1974
29.857
+0.979
3.39%
jan 1, 1975
26.958
-2.899
-9.71%
jan 1, 1976
27.318
+0.359
1.33%
jan 1, 1977
25.32
-1.997
-7.31%
jan 1, 1978
25.61
+0.289
1.14%
jan 1, 1979
27.237
+1.628
6.36%
jan 1, 1980
25.253
-1.984
-7.29%
jan 1, 1981
24.208
-1.045
-4.14%
jan 1, 1982
26.064
+1.857
7.67%
jan 1, 1983
25.069
-0.996
-3.82%
jan 1, 1984
26.342
+1.273
5.08%
jan 1, 1985
27.361
+1.019
3.87%
jan 1, 1986
28.189
+0.828
3.03%
jan 1, 1987
30.056
+1.867
6.62%
jan 1, 1988
29.131
-0.925
-3.08%
jan 1, 1989
26.82
-2.311
-7.93%
jan 1, 1990
25.272
-1.548
-5.77%
jan 1, 1991
24.774
-0.499
-1.97%
jan 1, 1992
25.712
+0.939
3.79%
jan 1, 1993
25.817
+0.105
0.41%
jan 1, 1994
26.318
+0.5
1.94%
jan 1, 1995
25.109
-1.208
-4.59%
jan 1, 1996
24.494
-0.616
-2.45%
jan 1, 1997
25.868
+1.374
5.61%
jan 1, 1998
24.944
-0.924
-3.57%
jan 1, 1999
24.438
-0.506
-2.03%
jan 1, 2000
25.223
+0.785
3.21%
jan 1, 2001
23.497
-1.726
-6.84%
jan 1, 2002
24.609
+1.111
4.73%
jan 1, 2003
23.248
-1.361
-5.53%
jan 1, 2004
24.18
+0.933
4.01%
jan 1, 2005
25.158
+0.978
4.04%
jan 1, 2006
24.406
-0.752
-2.99%
jan 1, 2007
23.711
-0.695
-2.85%
jan 1, 2008
22.006
-1.705
-7.19%
jan 1, 2009
24.039
+2.033
9.24%
jan 1, 2010
25.752
+1.713
7.13%
jan 1, 2011
24.791
-0.961
-3.73%
jan 1, 2012
22.577
-2.214
-8.93%
jan 1, 2013
24.286
+1.709
7.57%
jan 1, 2014
24.47
+0.184
0.76%
Ranking of countries by current statistics by years


Comments: