29
/
en
AIzaSyAYiBZKx7MnpbEhh9jyipgxe19OcubqV5w
April 1, 2024
56843
South Asia
SAS
false
2
1
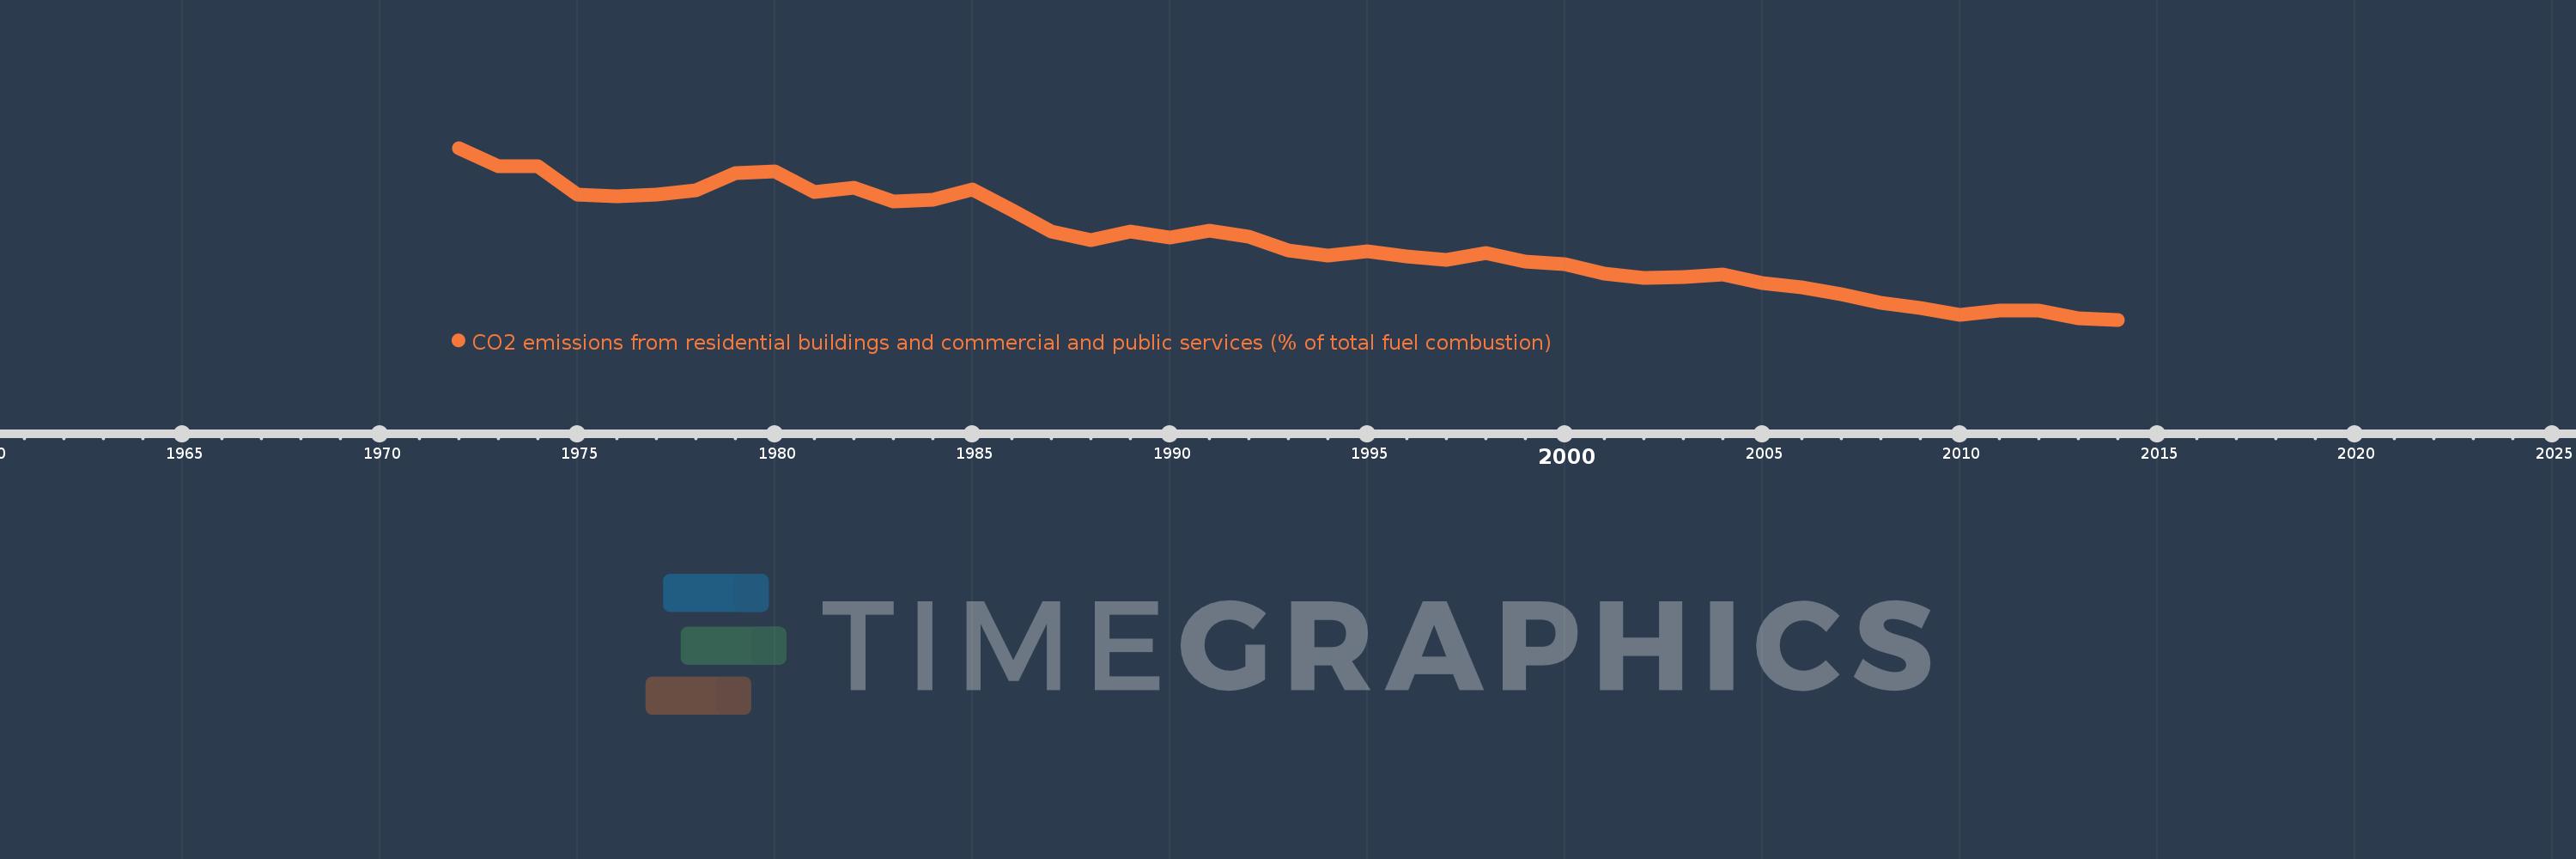
CO2 emissions from residential buildings and commercial and public services (% of total fuel combustion)
2014,2013,2012,2011,2010,2009,2008,2007,2006,2005,2004,2003,2002,2001,2000,1999,1998,1997,1996,1995,1994,1993,1992,1991,1990,1989,1988,1987,1986,1985,1984,1983,1982,1981,1980,1979,1978,1977,1976,1975,1974,1973,1972
This statistics in other country:
AlbaniaAlgeriaAngolaArab WorldArgentinaArmeniaAustraliaAustriaAzerbaijanBahrainBangladeshBelarusBelgiumBeninBoliviaBosnia and HerzegovinaBotswanaBrazilBrunei DarussalamBulgariaCambodiaCameroonCanadaCaribbean small statesCentral Europe and the BalticsChileChinaColombiaCongo, Dem. Rep.Congo, Rep.Costa RicaCote d'IvoireCroatiaCubaCuracaoCyprusCzech RepublicDenmarkDominican RepublicEarly-demographic dividendEast Asia & PacificEast Asia & Pacific (excluding high income)East Asia & Pacific (IDA & IBRD countries)EcuadorEgypt, Arab Rep.El SalvadorEritreaEstoniaEthiopiaEuro areaEurope & Central AsiaEurope & Central Asia (excluding high income)Europe & Central Asia (IDA & IBRD countries)European UnionFinlandFragile and conflict affected situationsFranceGabonGeorgiaGermanyGhanaGibraltarGreeceGuatemalaHaitiHeavily indebted poor countries (HIPC)High incomeHondurasHong Kong SAR, ChinaHungaryIBRD onlyIcelandIDA & IBRD totalIDA blendIDA onlyIDA totalIndiaIndonesiaIran, Islamic Rep.IraqIrelandIsraelItalyJamaicaJapanJordanKazakhstanKenyaKorea, Dem. People’s Rep.Korea, Rep.KosovoKuwaitKyrgyz RepublicLate-demographic dividendLatin America & Caribbean Latin America & Caribbean (excluding high income)Latin America & the Caribbean (IDA & IBRD countries)LatviaLeast developed countries: UN classificationLebanonLibyaLithuaniaLow & middle incomeLow incomeLower middle incomeLuxembourgMacedonia, FYRMalaysiaMaltaMauritiusMexicoMiddle East & North AfricaMiddle East & North Africa (excluding high income)Middle East & North Africa (IDA & IBRD countries)Middle incomeMoldovaMongoliaMontenegroMoroccoMozambiqueMyanmarNamibiaNepalNetherlandsNew ZealandNicaraguaNigerNigeriaNorth AmericaNorwayOECD membersOmanOther small statesPakistanPanamaParaguayPeruPhilippinesPolandPortugalPost-demographic dividendPre-demographic dividendQatarRomaniaRussian FederationSaudi ArabiaSenegalSerbiaSingaporeSlovak RepublicSloveniaSmall statesSouth AfricaSouth AsiaSouth Asia (IDA & IBRD)South SudanSpainSri LankaSub-Saharan Africa Sub-Saharan Africa (excluding high income)Sub-Saharan Africa (IDA & IBRD countries)SudanSwedenSwitzerlandSyrian Arab RepublicTajikistanTanzaniaThailandTogoTrinidad and TobagoTunisiaTurkeyTurkmenistanUkraineUnited Arab EmiratesUnited KingdomUnited StatesUpper middle incomeUruguayUzbekistanVenezuela, RBVietnamWorldYemen, Rep.ZambiaZimbabwe Timeline:
This timeline shows a graph from 1972 to 2014 of South Asia. No data until 1971. Number of actual observations by date: 43.
Source name:
World Development Indicators
Source organization:
IEA Statistics © OECD/IEA 2014 (http://www.iea.org/stats/index.asp), subject to https://www.iea.org/t&c/termsandconditions/
Categories, topics:
Environment
Last updated:
apr 23, 2017
Indicators value changes by year
Maximum:
15.636
jan 1, 1972
At the date of observation
Value
Absolute change
Change from previous value
jan 1, 1972
15.636
+15.636
0.0%
jan 1, 1973
14.681
-0.955
-6.11%
jan 1, 1974
14.683
+0.002
0.01%
jan 1, 1975
13.188
-1.494
-10.18%
jan 1, 1976
13.1
-0.088
-0.67%
jan 1, 1977
13.173
+0.073
0.56%
jan 1, 1978
13.388
+0.215
1.63%
jan 1, 1979
14.324
+0.936
6.99%
jan 1, 1980
14.414
+0.09
0.63%
jan 1, 1981
13.309
-1.105
-7.66%
jan 1, 1982
13.541
+0.232
1.74%
jan 1, 1983
12.828
-0.713
-5.26%
jan 1, 1984
12.917
+0.089
0.69%
jan 1, 1985
13.453
+0.536
4.15%
jan 1, 1986
12.385
-1.068
-7.94%
jan 1, 1987
11.228
-1.157
-9.34%
jan 1, 1988
10.799
-0.429
-3.82%
jan 1, 1989
11.241
+0.442
4.09%
jan 1, 1990
10.907
-0.333
-2.97%
jan 1, 1991
11.3
+0.393
3.6%
jan 1, 1992
10.963
-0.337
-2.98%
jan 1, 1993
10.254
-0.709
-6.47%
jan 1, 1994
9.967
-0.287
-2.8%
jan 1, 1995
10.194
+0.227
2.28%
jan 1, 1996
9.94
-0.254
-2.49%
jan 1, 1997
9.735
-0.205
-2.06%
jan 1, 1998
10.093
+0.358
3.68%
jan 1, 1999
9.647
-0.446
-4.42%
jan 1, 2000
9.543
-0.104
-1.08%
jan 1, 2001
9.044
-0.499
-5.23%
jan 1, 2002
8.806
-0.238
-2.63%
jan 1, 2003
8.867
+0.061
0.69%
jan 1, 2004
8.962
+0.095
1.07%
jan 1, 2005
8.541
-0.421
-4.7%
jan 1, 2006
8.293
-0.248
-2.9%
jan 1, 2007
7.959
-0.335
-4.03%
jan 1, 2008
7.486
-0.472
-5.94%
jan 1, 2009
7.218
-0.268
-3.58%
jan 1, 2010
6.878
-0.341
-4.72%
jan 1, 2011
7.107
+0.23
3.34%
jan 1, 2012
7.105
-0.002
-0.03%
jan 1, 2013
6.693
-0.412
-5.79%
jan 1, 2014
6.602
-0.091
-1.36%
Ranking of countries by current statistics by years


Comments: