29
/
en
AIzaSyAYiBZKx7MnpbEhh9jyipgxe19OcubqV5w
April 1, 2024
92433
Brunei Darussalam
BRN
true
2
1
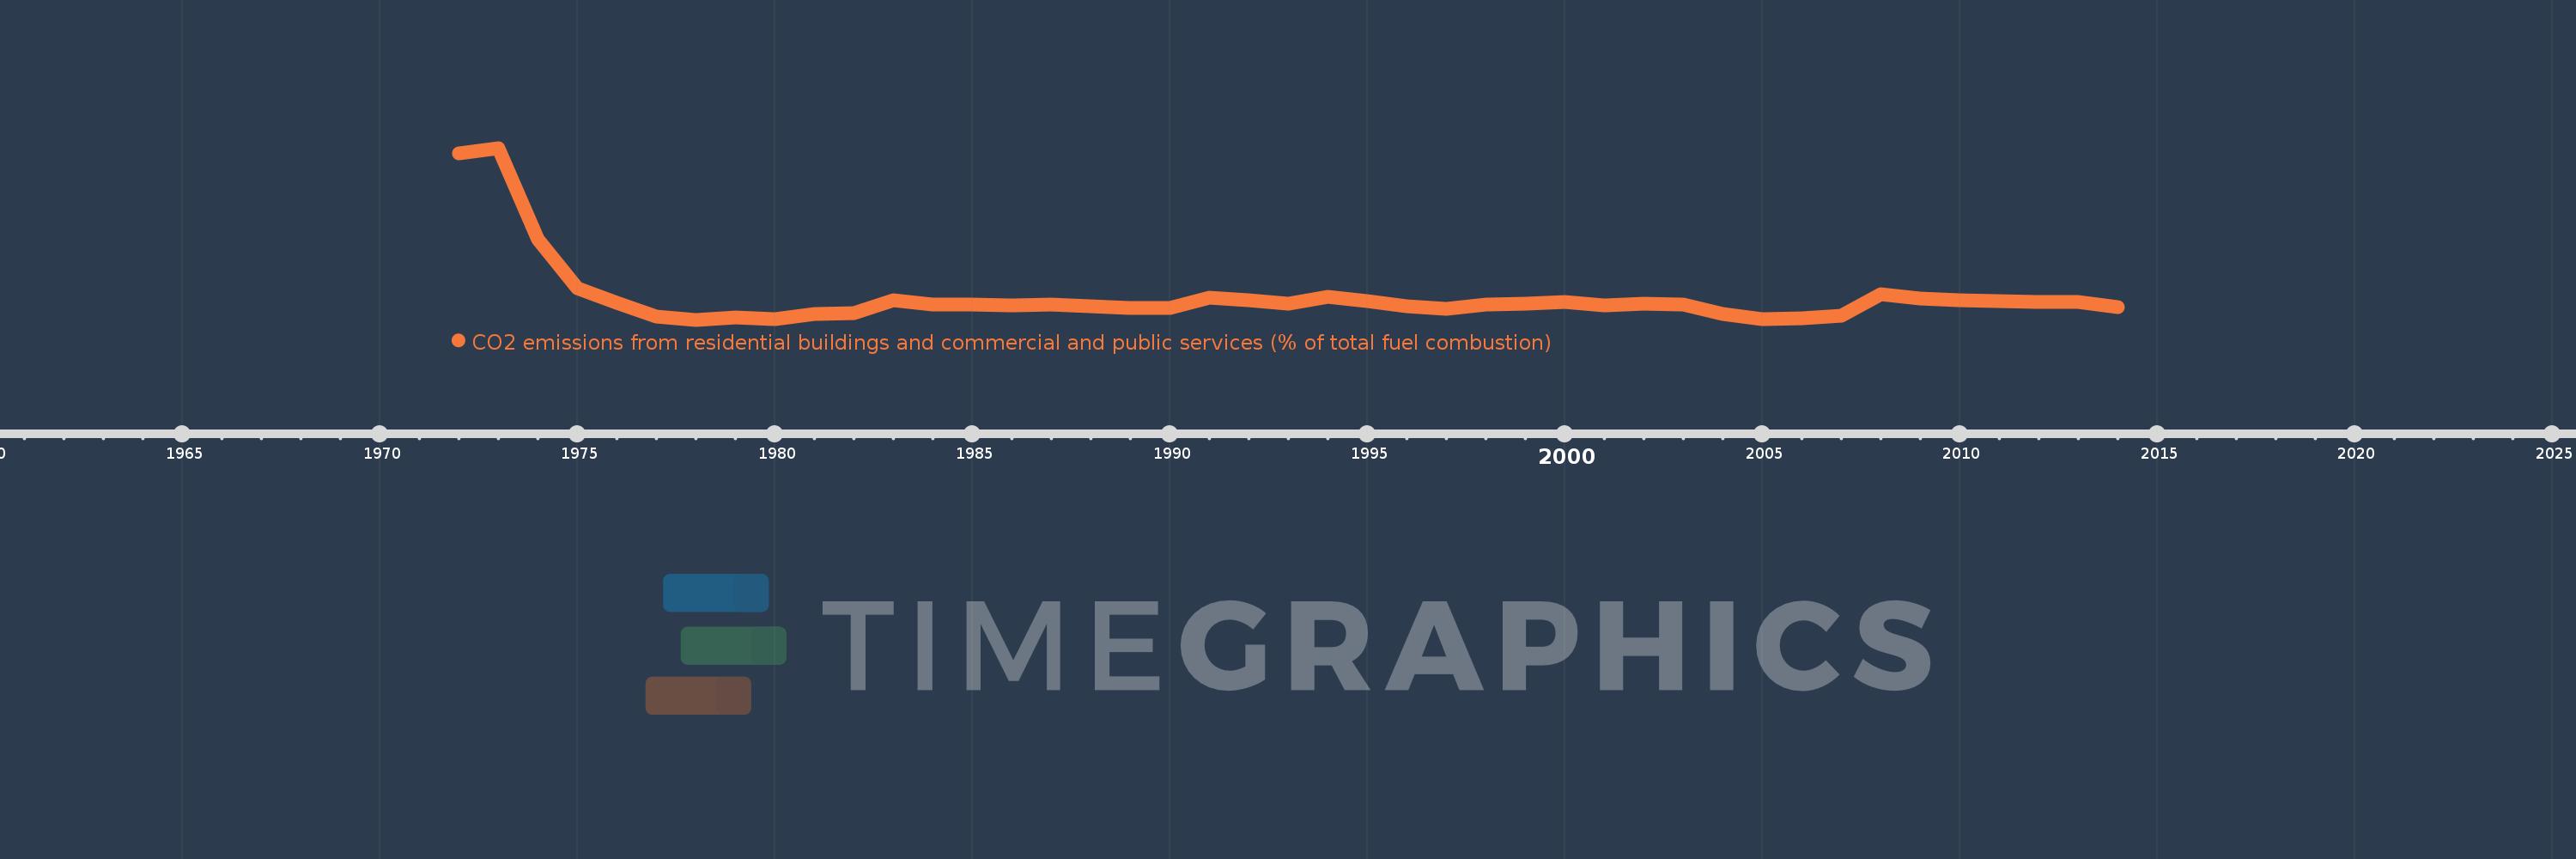
CO2 emissions from residential buildings and commercial and public services (% of total fuel combustion)
2014,2013,2012,2011,2010,2009,2008,2007,2006,2005,2004,2003,2002,2001,2000,1999,1998,1997,1996,1995,1994,1993,1992,1991,1990,1989,1988,1987,1986,1985,1984,1983,1982,1981,1980,1979,1978,1977,1976,1975,1974,1973,1972
This statistics in other country:
AlbaniaAlgeriaAngolaArab WorldArgentinaArmeniaAustraliaAustriaAzerbaijanBahrainBangladeshBelarusBelgiumBeninBoliviaBosnia and HerzegovinaBotswanaBrazilBrunei DarussalamBulgariaCambodiaCameroonCanadaCaribbean small statesCentral Europe and the BalticsChileChinaColombiaCongo, Dem. Rep.Congo, Rep.Costa RicaCote d'IvoireCroatiaCubaCuracaoCyprusCzech RepublicDenmarkDominican RepublicEarly-demographic dividendEast Asia & PacificEast Asia & Pacific (excluding high income)East Asia & Pacific (IDA & IBRD countries)EcuadorEgypt, Arab Rep.El SalvadorEritreaEstoniaEthiopiaEuro areaEurope & Central AsiaEurope & Central Asia (excluding high income)Europe & Central Asia (IDA & IBRD countries)European UnionFinlandFragile and conflict affected situationsFranceGabonGeorgiaGermanyGhanaGibraltarGreeceGuatemalaHaitiHeavily indebted poor countries (HIPC)High incomeHondurasHong Kong SAR, ChinaHungaryIBRD onlyIcelandIDA & IBRD totalIDA blendIDA onlyIDA totalIndiaIndonesiaIran, Islamic Rep.IraqIrelandIsraelItalyJamaicaJapanJordanKazakhstanKenyaKorea, Dem. People’s Rep.Korea, Rep.KosovoKuwaitKyrgyz RepublicLate-demographic dividendLatin America & Caribbean Latin America & Caribbean (excluding high income)Latin America & the Caribbean (IDA & IBRD countries)LatviaLeast developed countries: UN classificationLebanonLibyaLithuaniaLow & middle incomeLow incomeLower middle incomeLuxembourgMacedonia, FYRMalaysiaMaltaMauritiusMexicoMiddle East & North AfricaMiddle East & North Africa (excluding high income)Middle East & North Africa (IDA & IBRD countries)Middle incomeMoldovaMongoliaMontenegroMoroccoMozambiqueMyanmarNamibiaNepalNetherlandsNew ZealandNicaraguaNigerNigeriaNorth AmericaNorwayOECD membersOmanOther small statesPakistanPanamaParaguayPeruPhilippinesPolandPortugalPost-demographic dividendPre-demographic dividendQatarRomaniaRussian FederationSaudi ArabiaSenegalSerbiaSingaporeSlovak RepublicSloveniaSmall statesSouth AfricaSouth AsiaSouth Asia (IDA & IBRD)South SudanSpainSri LankaSub-Saharan Africa Sub-Saharan Africa (excluding high income)Sub-Saharan Africa (IDA & IBRD countries)SudanSwedenSwitzerlandSyrian Arab RepublicTajikistanTanzaniaThailandTogoTrinidad and TobagoTunisiaTurkeyTurkmenistanUkraineUnited Arab EmiratesUnited KingdomUnited StatesUpper middle incomeUruguayUzbekistanVenezuela, RBVietnamWorldYemen, Rep.ZambiaZimbabwe Timeline:
This timeline shows a graph from 1972 to 2014 of Brunei Darussalam. No data until 1971. Number of actual observations by date: 43.
Source name:
World Development Indicators
Source organization:
IEA Statistics © OECD/IEA 2014 (http://www.iea.org/stats/index.asp), subject to https://www.iea.org/t&c/termsandconditions/
Categories, topics:
Environment
Last updated:
apr 23, 2017
Indicators value changes by year
At the date of observation
Value
Absolute change
Change from previous value
jan 1, 1973
5.128
+0.128
2.56%
jan 1, 1974
2.941
-2.187
-42.65%
jan 1, 1975
1.754
-1.187
-40.35%
jan 1, 1976
1.418
-0.336
-19.15%
jan 1, 1977
1.081
-0.337
-23.78%
jan 1, 1978
1.005
-0.076
-7.04%
jan 1, 1979
1.07
+0.064
6.42%
jan 1, 1980
1.02
-0.049
-4.59%
jan 1, 1981
1.136
+0.116
11.36%
jan 1, 1982
1.158
+0.022
1.93%
jan 1, 1983
1.476
+0.318
27.43%
jan 1, 1984
1.375
-0.101
-6.87%
jan 1, 1985
1.365
-0.009
-0.68%
jan 1, 1986
1.356
-0.009
-0.68%
jan 1, 1987
1.361
+0.005
0.34%
jan 1, 1988
1.338
-0.023
-1.67%
jan 1, 1989
1.278
-0.06
-4.47%
jan 1, 1990
1.286
+0.008
0.64%
jan 1, 1991
1.534
+0.248
19.25%
jan 1, 1992
1.479
-0.054
-3.55%
jan 1, 1993
1.397
-0.083
-5.59%
jan 1, 1994
1.554
+0.158
11.3%
jan 1, 1995
1.449
-0.105
-6.76%
jan 1, 1996
1.333
-0.116
-8.0%
jan 1, 1997
1.274
-0.059
-4.46%
jan 1, 1998
1.375
+0.101
7.96%
jan 1, 1999
1.392
+0.017
1.23%
jan 1, 2000
1.432
+0.04
2.86%
jan 1, 2001
1.357
-0.075
-5.2%
jan 1, 2002
1.392
+0.035
2.55%
jan 1, 2003
1.376
-0.016
-1.15%
jan 1, 2004
1.143
-0.233
-16.95%
jan 1, 2005
1.016
-0.127
-11.08%
jan 1, 2006
1.037
+0.021
2.07%
jan 1, 2007
1.11
+0.072
6.96%
jan 1, 2008
1.608
+0.499
44.94%
jan 1, 2009
1.524
-0.085
-5.26%
jan 1, 2010
1.48
-0.043
-2.83%
jan 1, 2011
1.458
-0.023
-1.54%
jan 1, 2012
1.427
-0.031
-2.14%
jan 1, 2013
1.435
+0.008
0.57%
jan 1, 2014
1.314
-0.121
-8.42%
Ranking of countries by current statistics by years


Comments: