29
/
en
AIzaSyAYiBZKx7MnpbEhh9jyipgxe19OcubqV5w
April 1, 2024
38004
IDA blend
IDB
false
2
1
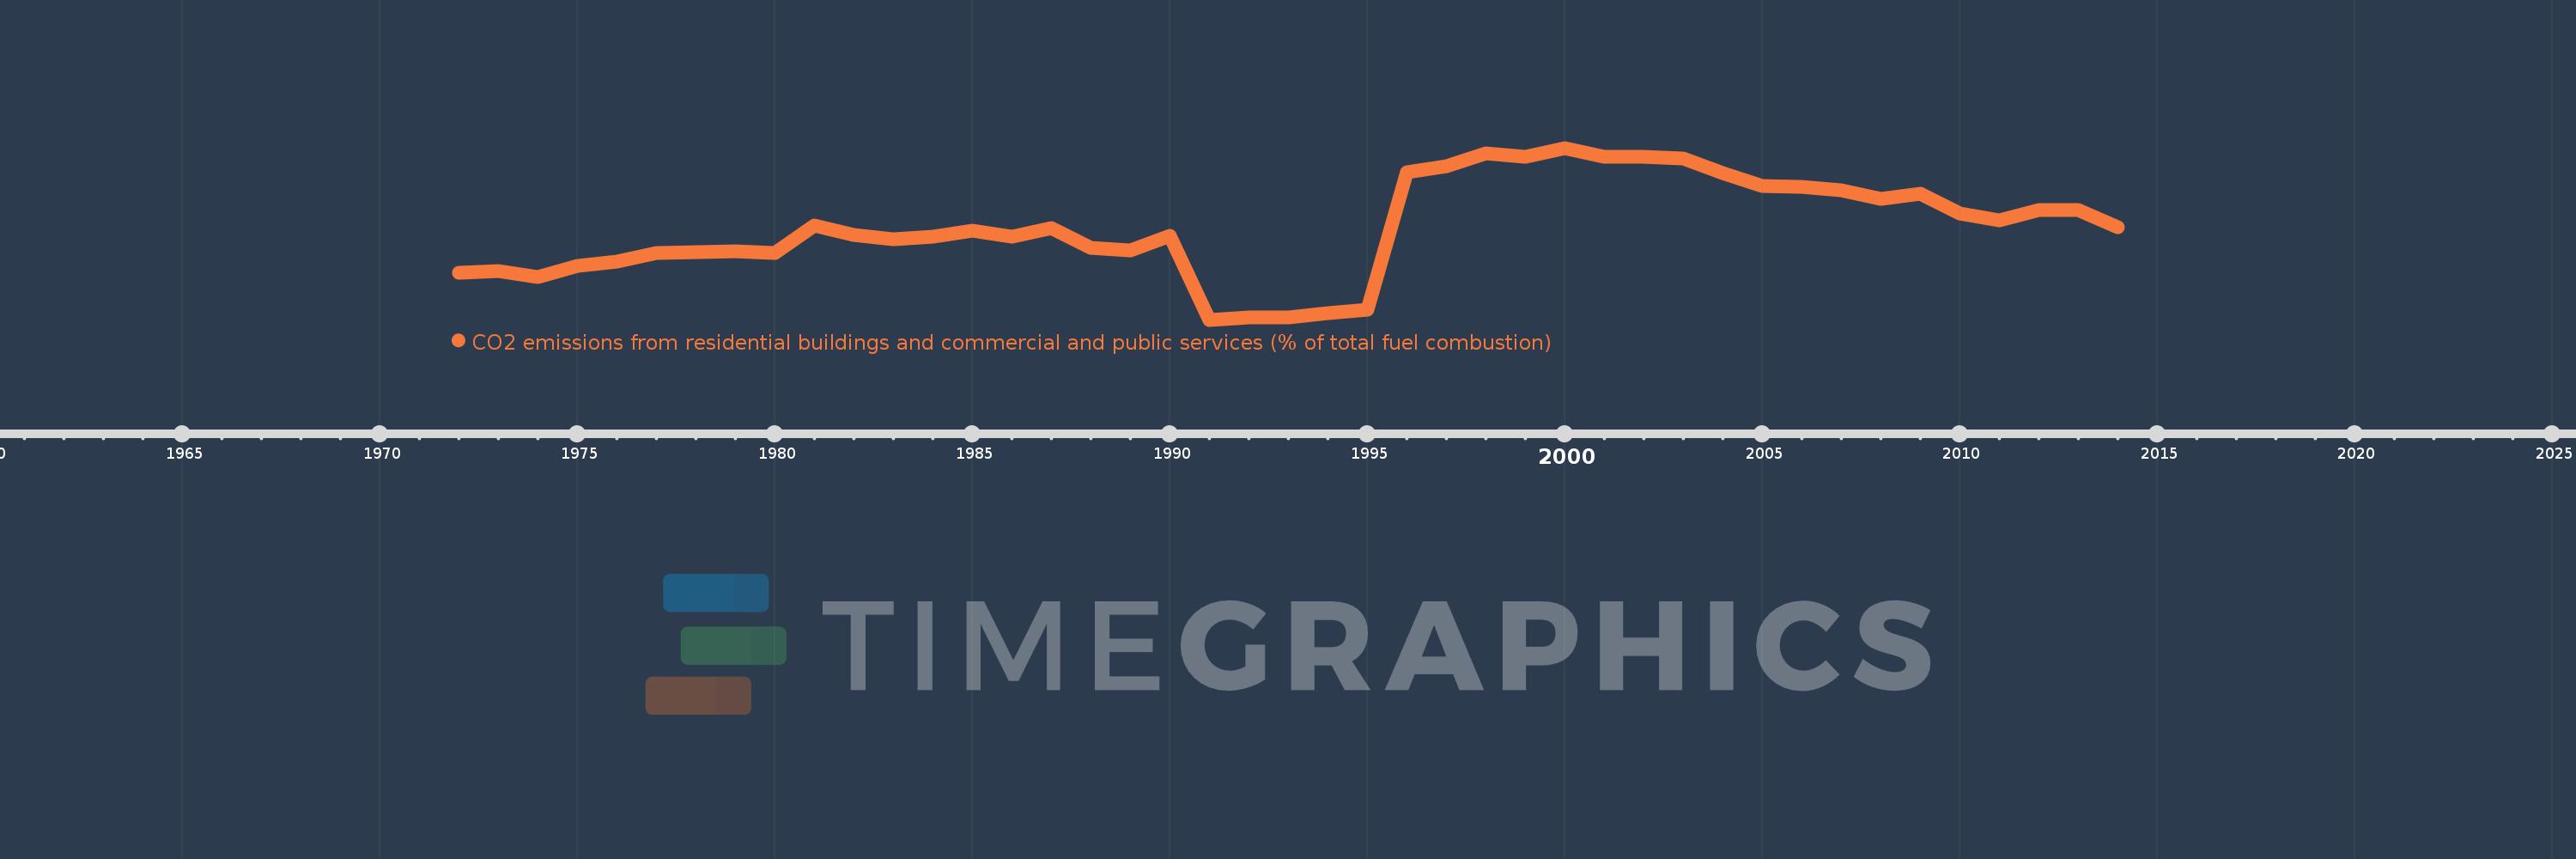
CO2 emissions from residential buildings and commercial and public services (% of total fuel combustion)
2014,2013,2012,2011,2010,2009,2008,2007,2006,2005,2004,2003,2002,2001,2000,1999,1998,1997,1996,1995,1994,1993,1992,1991,1990,1989,1988,1987,1986,1985,1984,1983,1982,1981,1980,1979,1978,1977,1976,1975,1974,1973,1972
This statistics in other country:
AlbaniaAlgeriaAngolaArab WorldArgentinaArmeniaAustraliaAustriaAzerbaijanBahrainBangladeshBelarusBelgiumBeninBoliviaBosnia and HerzegovinaBotswanaBrazilBrunei DarussalamBulgariaCambodiaCameroonCanadaCaribbean small statesCentral Europe and the BalticsChileChinaColombiaCongo, Dem. Rep.Congo, Rep.Costa RicaCote d'IvoireCroatiaCubaCuracaoCyprusCzech RepublicDenmarkDominican RepublicEarly-demographic dividendEast Asia & PacificEast Asia & Pacific (excluding high income)East Asia & Pacific (IDA & IBRD countries)EcuadorEgypt, Arab Rep.El SalvadorEritreaEstoniaEthiopiaEuro areaEurope & Central AsiaEurope & Central Asia (excluding high income)Europe & Central Asia (IDA & IBRD countries)European UnionFinlandFragile and conflict affected situationsFranceGabonGeorgiaGermanyGhanaGibraltarGreeceGuatemalaHaitiHeavily indebted poor countries (HIPC)High incomeHondurasHong Kong SAR, ChinaHungaryIBRD onlyIcelandIDA & IBRD totalIDA blendIDA onlyIDA totalIndiaIndonesiaIran, Islamic Rep.IraqIrelandIsraelItalyJamaicaJapanJordanKazakhstanKenyaKorea, Dem. People’s Rep.Korea, Rep.KosovoKuwaitKyrgyz RepublicLate-demographic dividendLatin America & Caribbean Latin America & Caribbean (excluding high income)Latin America & the Caribbean (IDA & IBRD countries)LatviaLeast developed countries: UN classificationLebanonLibyaLithuaniaLow & middle incomeLow incomeLower middle incomeLuxembourgMacedonia, FYRMalaysiaMaltaMauritiusMexicoMiddle East & North AfricaMiddle East & North Africa (excluding high income)Middle East & North Africa (IDA & IBRD countries)Middle incomeMoldovaMongoliaMontenegroMoroccoMozambiqueMyanmarNamibiaNepalNetherlandsNew ZealandNicaraguaNigerNigeriaNorth AmericaNorwayOECD membersOmanOther small statesPakistanPanamaParaguayPeruPhilippinesPolandPortugalPost-demographic dividendPre-demographic dividendQatarRomaniaRussian FederationSaudi ArabiaSenegalSerbiaSingaporeSlovak RepublicSloveniaSmall statesSouth AfricaSouth AsiaSouth Asia (IDA & IBRD)South SudanSpainSri LankaSub-Saharan Africa Sub-Saharan Africa (excluding high income)Sub-Saharan Africa (IDA & IBRD countries)SudanSwedenSwitzerlandSyrian Arab RepublicTajikistanTanzaniaThailandTogoTrinidad and TobagoTunisiaTurkeyTurkmenistanUkraineUnited Arab EmiratesUnited KingdomUnited StatesUpper middle incomeUruguayUzbekistanVenezuela, RBVietnamWorldYemen, Rep.ZambiaZimbabwe Timeline:
This timeline shows a graph from 1972 to 2014 of IDA blend. No data until 1971. Number of actual observations by date: 43.
Source name:
World Development Indicators
Source organization:
IEA Statistics © OECD/IEA 2014 (http://www.iea.org/stats/index.asp), subject to https://www.iea.org/t&c/termsandconditions/
Categories, topics:
Environment
Last updated:
apr 23, 2017
Indicators value changes by year
Maximum:
20.007
jan 1, 2000
At the date of observation
Value
Absolute change
Change from previous value
jan 1, 1972
10.243
+10.243
0.0%
jan 1, 1973
10.345
+0.101
0.99%
jan 1, 1974
9.872
-0.473
-4.57%
jan 1, 1975
10.756
+0.884
8.95%
jan 1, 1976
11.074
+0.318
2.96%
jan 1, 1977
11.797
+0.723
6.53%
jan 1, 1978
11.838
+0.042
0.35%
jan 1, 1979
11.906
+0.067
0.57%
jan 1, 1980
11.793
-0.113
-0.95%
jan 1, 1981
13.939
+2.146
18.19%
jan 1, 1982
13.175
-0.764
-5.48%
jan 1, 1983
12.887
-0.287
-2.18%
jan 1, 1984
13.041
+0.154
1.2%
jan 1, 1985
13.495
+0.454
3.48%
jan 1, 1986
13.045
-0.45
-3.34%
jan 1, 1987
13.725
+0.68
5.21%
jan 1, 1988
12.203
-1.522
-11.09%
jan 1, 1989
12.008
-0.195
-1.59%
jan 1, 1990
13.091
+1.083
9.02%
jan 1, 1991
6.549
-6.542
-49.97%
jan 1, 1992
6.744
+0.195
2.98%
jan 1, 1993
6.711
-0.034
-0.5%
jan 1, 1994
7.07
+0.36
5.36%
jan 1, 1995
7.343
+0.273
3.85%
jan 1, 1996
18.114
+10.771
146.69%
jan 1, 1997
18.566
+0.452
2.5%
jan 1, 1998
19.605
+1.039
5.59%
jan 1, 1999
19.33
-0.275
-1.4%
jan 1, 2000
20.007
+0.677
3.5%
jan 1, 2001
19.32
-0.687
-3.43%
jan 1, 2002
19.339
+0.019
0.1%
jan 1, 2003
19.187
-0.152
-0.79%
jan 1, 2004
18.059
-1.127
-5.87%
jan 1, 2005
17.019
-1.04
-5.76%
jan 1, 2006
16.966
-0.053
-0.31%
jan 1, 2007
16.68
-0.286
-1.69%
jan 1, 2008
16.002
-0.678
-4.06%
jan 1, 2009
16.424
+0.422
2.64%
jan 1, 2010
14.904
-1.52
-9.26%
jan 1, 2011
14.356
-0.548
-3.68%
jan 1, 2012
15.145
+0.789
5.5%
jan 1, 2013
15.125
-0.02
-0.13%
jan 1, 2014
13.798
-1.327
-8.78%
Ranking of countries by current statistics by years


Comments: