29
/
en
AIzaSyAYiBZKx7MnpbEhh9jyipgxe19OcubqV5w
April 1, 2024
260634
Tanzania
TZA
true
2
1
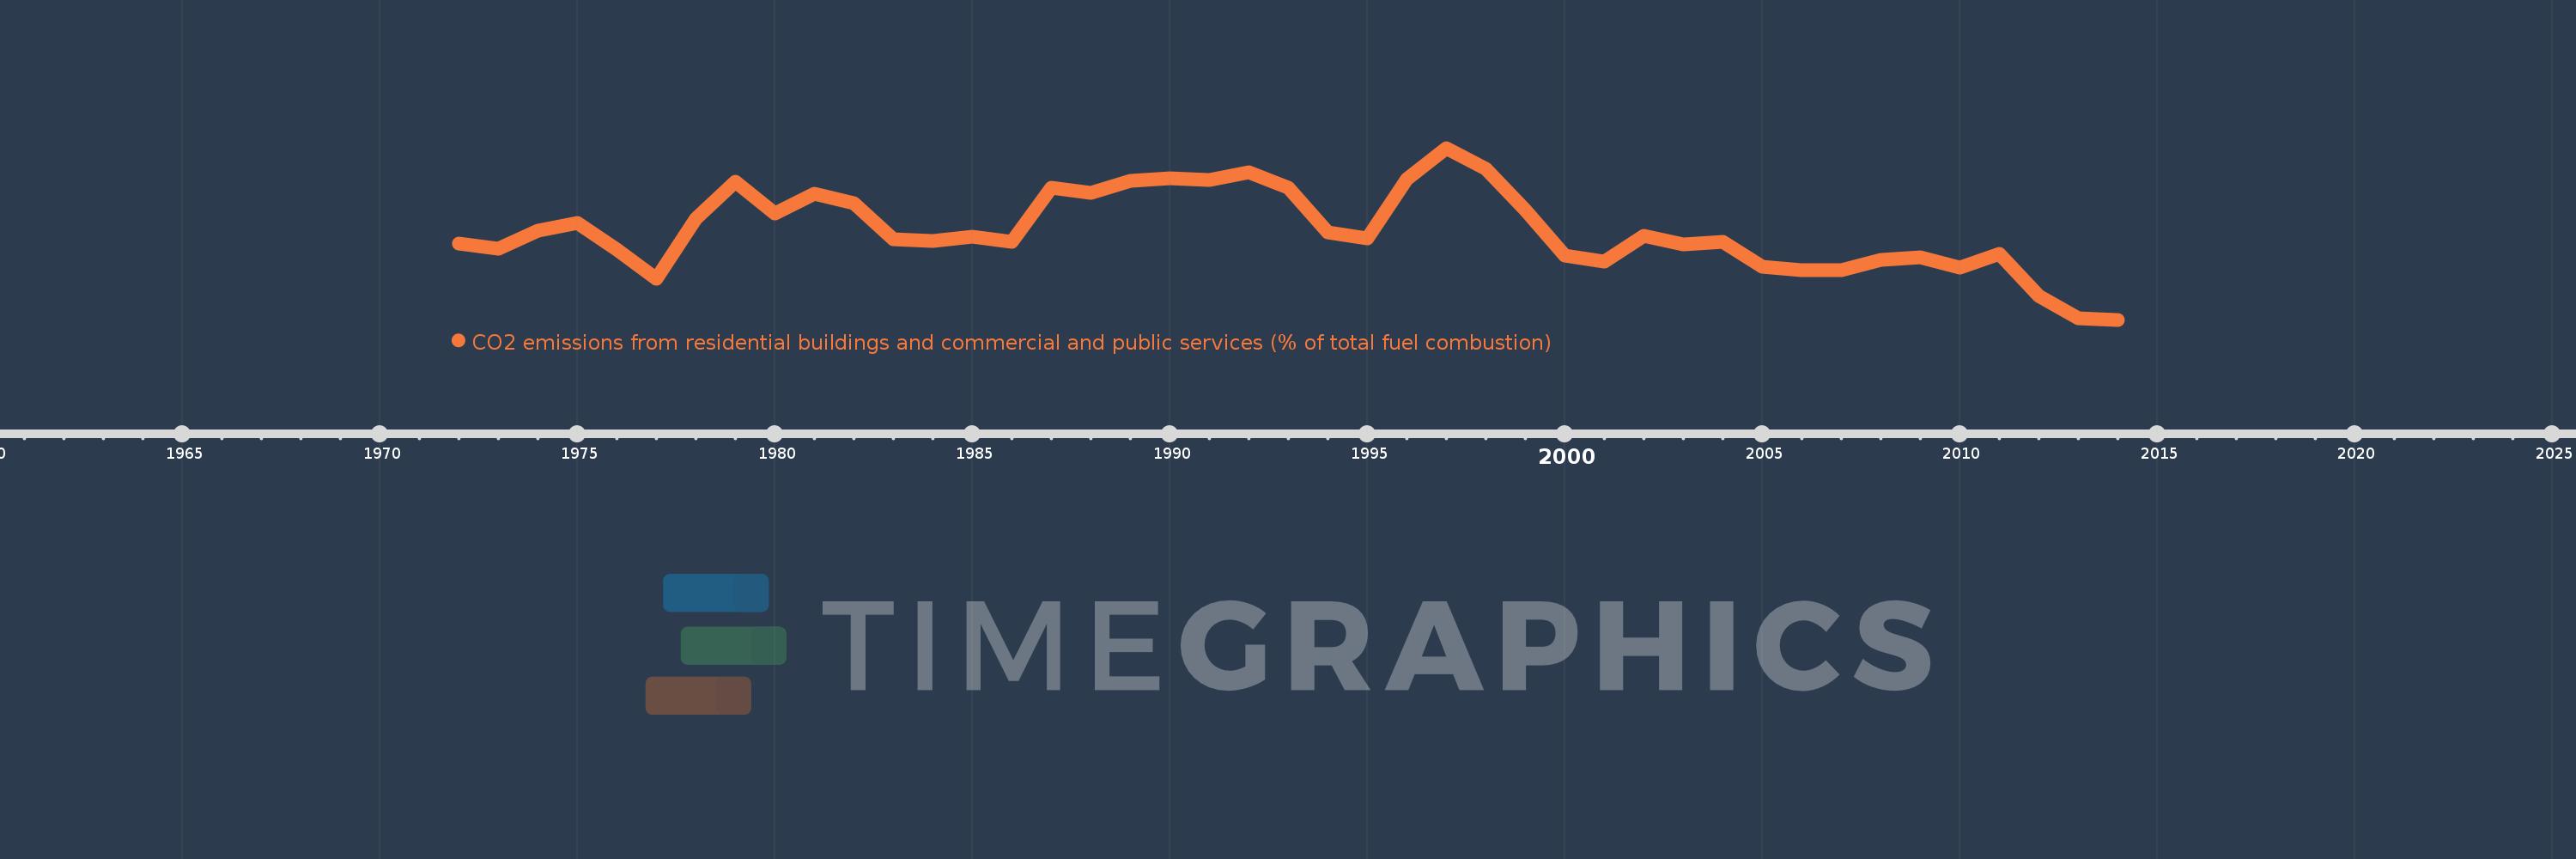
CO2 emissions from residential buildings and commercial and public services (% of total fuel combustion)
2014,2013,2012,2011,2010,2009,2008,2007,2006,2005,2004,2003,2002,2001,2000,1999,1998,1997,1996,1995,1994,1993,1992,1991,1990,1989,1988,1987,1986,1985,1984,1983,1982,1981,1980,1979,1978,1977,1976,1975,1974,1973,1972
This statistics in other country:
AlbaniaAlgeriaAngolaArab WorldArgentinaArmeniaAustraliaAustriaAzerbaijanBahrainBangladeshBelarusBelgiumBeninBoliviaBosnia and HerzegovinaBotswanaBrazilBrunei DarussalamBulgariaCambodiaCameroonCanadaCaribbean small statesCentral Europe and the BalticsChileChinaColombiaCongo, Dem. Rep.Congo, Rep.Costa RicaCote d'IvoireCroatiaCubaCuracaoCyprusCzech RepublicDenmarkDominican RepublicEarly-demographic dividendEast Asia & PacificEast Asia & Pacific (excluding high income)East Asia & Pacific (IDA & IBRD countries)EcuadorEgypt, Arab Rep.El SalvadorEritreaEstoniaEthiopiaEuro areaEurope & Central AsiaEurope & Central Asia (excluding high income)Europe & Central Asia (IDA & IBRD countries)European UnionFinlandFragile and conflict affected situationsFranceGabonGeorgiaGermanyGhanaGibraltarGreeceGuatemalaHaitiHeavily indebted poor countries (HIPC)High incomeHondurasHong Kong SAR, ChinaHungaryIBRD onlyIcelandIDA & IBRD totalIDA blendIDA onlyIDA totalIndiaIndonesiaIran, Islamic Rep.IraqIrelandIsraelItalyJamaicaJapanJordanKazakhstanKenyaKorea, Dem. People’s Rep.Korea, Rep.KosovoKuwaitKyrgyz RepublicLate-demographic dividendLatin America & Caribbean Latin America & Caribbean (excluding high income)Latin America & the Caribbean (IDA & IBRD countries)LatviaLeast developed countries: UN classificationLebanonLibyaLithuaniaLow & middle incomeLow incomeLower middle incomeLuxembourgMacedonia, FYRMalaysiaMaltaMauritiusMexicoMiddle East & North AfricaMiddle East & North Africa (excluding high income)Middle East & North Africa (IDA & IBRD countries)Middle incomeMoldovaMongoliaMontenegroMoroccoMozambiqueMyanmarNamibiaNepalNetherlandsNew ZealandNicaraguaNigerNigeriaNorth AmericaNorwayOECD membersOmanOther small statesPakistanPanamaParaguayPeruPhilippinesPolandPortugalPost-demographic dividendPre-demographic dividendQatarRomaniaRussian FederationSaudi ArabiaSenegalSerbiaSingaporeSlovak RepublicSloveniaSmall statesSouth AfricaSouth AsiaSouth Asia (IDA & IBRD)South SudanSpainSri LankaSub-Saharan Africa Sub-Saharan Africa (excluding high income)Sub-Saharan Africa (IDA & IBRD countries)SudanSwedenSwitzerlandSyrian Arab RepublicTajikistanTanzaniaThailandTogoTrinidad and TobagoTunisiaTurkeyTurkmenistanUkraineUnited Arab EmiratesUnited KingdomUnited StatesUpper middle incomeUruguayUzbekistanVenezuela, RBVietnamWorldYemen, Rep.ZambiaZimbabwe Timeline:
This timeline shows a graph from 1972 to 2014 of Tanzania. No data until 1971. Number of actual observations by date: 43.
Source name:
World Development Indicators
Source organization:
IEA Statistics © OECD/IEA 2014 (http://www.iea.org/stats/index.asp), subject to https://www.iea.org/t&c/termsandconditions/
Categories, topics:
Environment
Last updated:
apr 23, 2017
Indicators value changes by year
Maximum:
24.188
jan 1, 1997
At the date of observation
Value
Absolute change
Change from previous value
jan 1, 1972
12.857
+12.857
0.0%
jan 1, 1973
12.195
-0.662
-5.15%
jan 1, 1974
14.371
+2.176
17.84%
jan 1, 1975
15.333
+0.962
6.69%
jan 1, 1976
12.143
-3.19
-20.81%
jan 1, 1977
8.696
-3.447
-28.39%
jan 1, 1978
15.827
+7.132
82.01%
jan 1, 1979
20.134
+4.307
27.21%
jan 1, 1980
16.447
-3.687
-18.31%
jan 1, 1981
18.792
+2.345
14.26%
jan 1, 1982
17.687
-1.105
-5.88%
jan 1, 1983
13.333
-4.354
-24.62%
jan 1, 1984
13.139
-0.195
-1.46%
jan 1, 1985
13.669
+0.53
4.04%
jan 1, 1986
13.014
-0.655
-4.79%
jan 1, 1987
19.481
+6.467
49.69%
jan 1, 1988
18.831
-0.649
-3.33%
jan 1, 1989
20.253
+1.422
7.55%
jan 1, 1990
20.625
+0.372
1.84%
jan 1, 1991
20.359
-0.266
-1.29%
jan 1, 1992
21.341
+0.982
4.82%
jan 1, 1993
19.512
-1.829
-8.57%
jan 1, 1994
14.201
-5.311
-27.22%
jan 1, 1995
13.483
-0.718
-5.06%
jan 1, 1996
20.482
+6.999
51.91%
jan 1, 1997
24.188
+3.706
18.09%
jan 1, 1998
21.673
-2.515
-10.4%
jan 1, 1999
16.807
-4.866
-22.45%
jan 1, 2000
11.468
-5.339
-31.77%
jan 1, 2001
10.728
-0.74
-6.45%
jan 1, 2002
13.768
+3.04
28.34%
jan 1, 2003
12.698
-1.07
-7.77%
jan 1, 2004
13.07
+0.371
2.93%
jan 1, 2005
10.066
-3.004
-22.99%
jan 1, 2006
9.703
-0.363
-3.6%
jan 1, 2007
9.725
+0.022
0.22%
jan 1, 2008
10.899
+1.174
12.07%
jan 1, 2009
11.255
+0.356
3.27%
jan 1, 2010
10.0
-1.255
-11.15%
jan 1, 2011
11.582
+1.582
15.82%
jan 1, 2012
6.657
-4.925
-42.52%
jan 1, 2013
4.014
-2.643
-39.7%
jan 1, 2014
3.814
-0.2
-4.98%
Ranking of countries by current statistics by years


Comments: