29
/
en
AIzaSyAYiBZKx7MnpbEhh9jyipgxe19OcubqV5w
April 1, 2024
44742
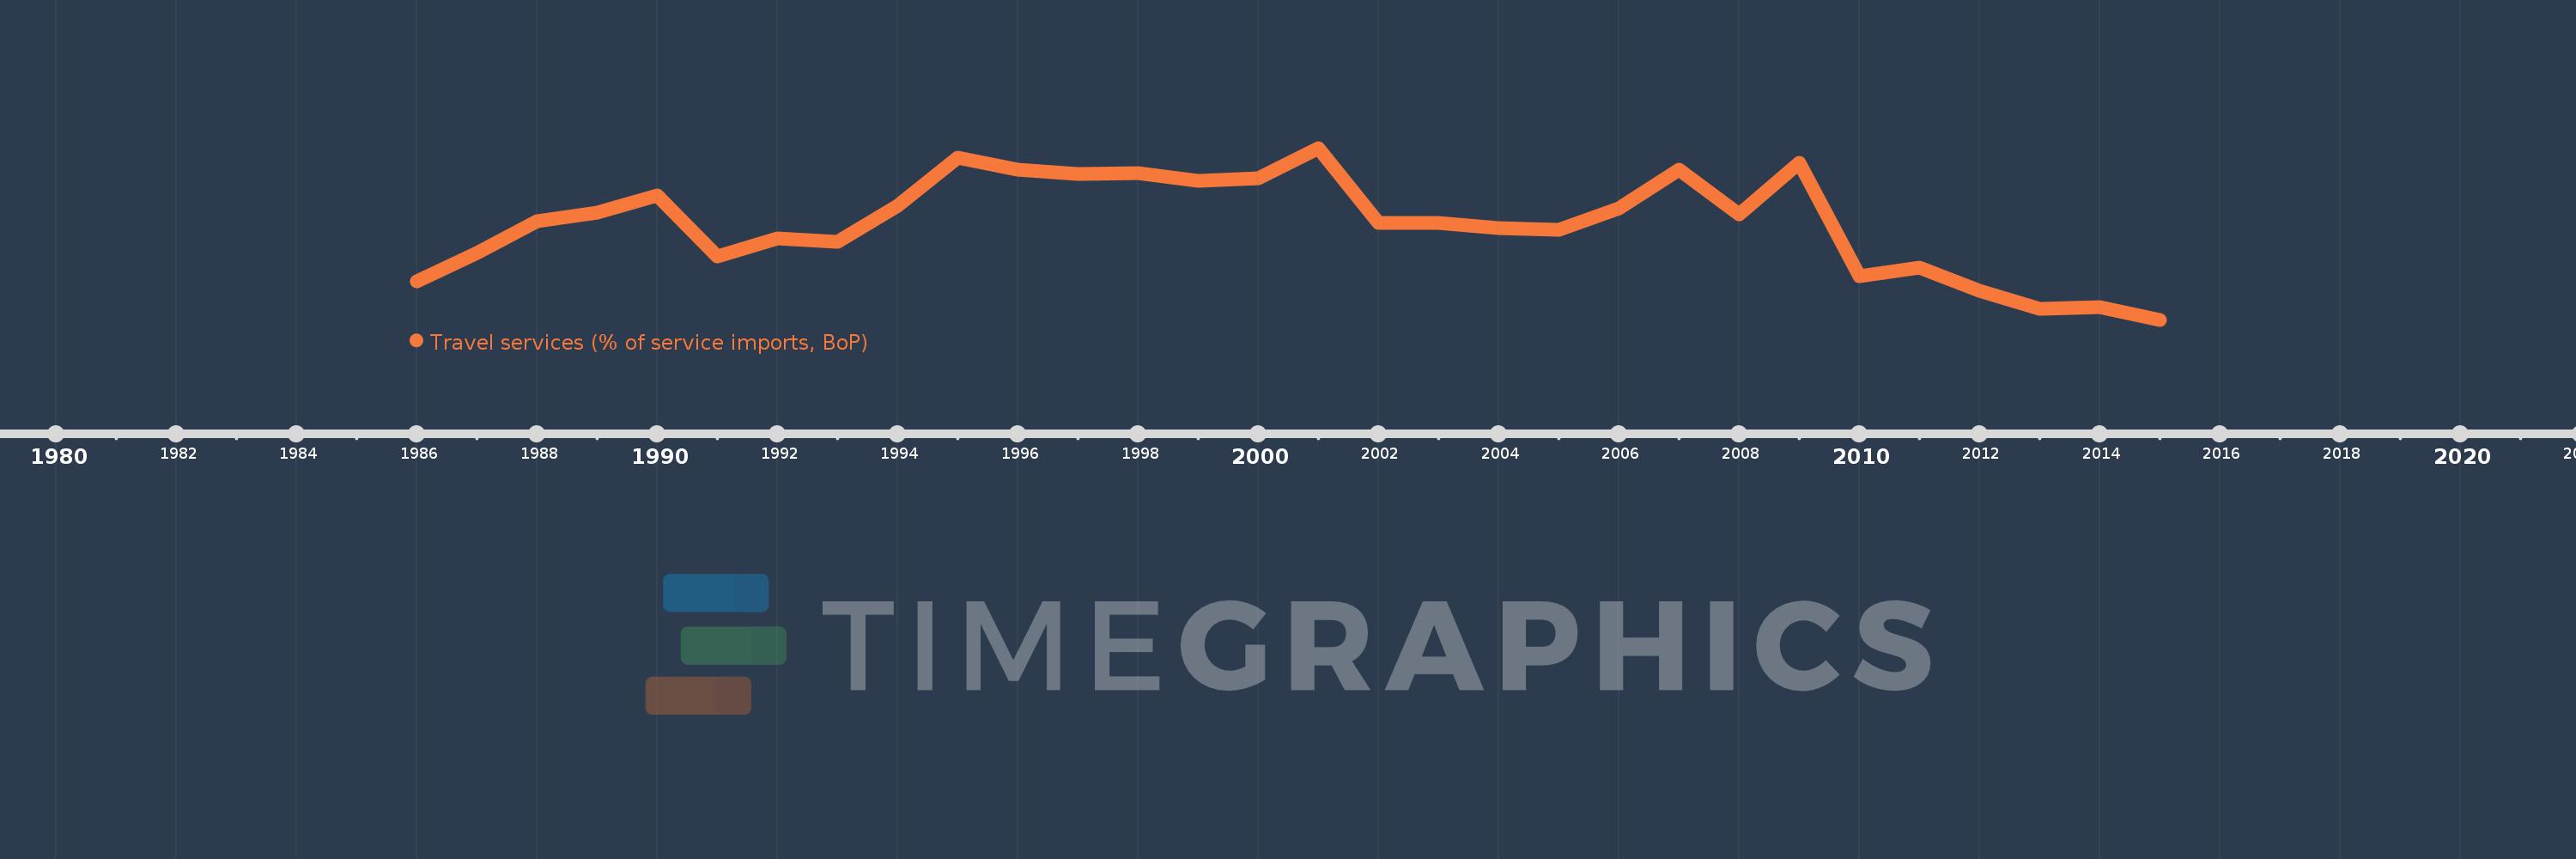
Least developed countries: UN classification
LDC
false
2
1
Travel services (% of service imports, BoP)
2015,2014,2013,2012,2011,2010,2009,2008,2007,2006,2005,2004,2003,2002,2001,2000,1999,1998,1997,1996,1995,1994,1993,1992,1991,1990,1989,1988,1987,1986
This statistics in other country:
AfghanistanAlbaniaAlgeriaAngolaAntigua and BarbudaArab WorldArgentinaArmeniaArubaAustraliaAustriaAzerbaijanBahamas, TheBahrainBangladeshBarbadosBelarusBelgiumBelizeBeninBermudaBhutanBoliviaBosnia and HerzegovinaBotswanaBrazilBrunei DarussalamBulgariaBurkina FasoBurundiCabo VerdeCambodiaCameroonCanadaCaribbean small statesCentral African RepublicCentral Europe and the BalticsChadChileChinaColombiaComorosCongo, Dem. Rep.Congo, Rep.Costa RicaCote d'IvoireCroatiaCuracaoCyprusCzech RepublicDenmarkDjiboutiDominicaDominican RepublicEarly-demographic dividendEast Asia & PacificEast Asia & Pacific (excluding high income)East Asia & Pacific (IDA & IBRD countries)EcuadorEgypt, Arab Rep.El SalvadorEritreaEstoniaEthiopiaEuro areaEurope & Central AsiaEurope & Central Asia (excluding high income)Europe & Central Asia (IDA & IBRD countries)European UnionFaroe IslandsFijiFinlandFragile and conflict affected situationsFranceFrench PolynesiaGabonGambia, TheGeorgiaGermanyGhanaGreeceGrenadaGuatemalaGuineaGuinea-BissauGuyanaHaitiHeavily indebted poor countries (HIPC)High incomeHondurasHong Kong SAR, ChinaHungaryIBRD onlyIcelandIDA & IBRD totalIDA onlyIDA totalIndiaIndonesiaIran, Islamic Rep.IraqIrelandIsraelItalyJamaicaJapanJordanKazakhstanKenyaKiribatiKorea, Rep.KosovoKuwaitKyrgyz RepublicLao PDRLate-demographic dividendLatin America & Caribbean Latin America & Caribbean (excluding high income)Latin America & the Caribbean (IDA & IBRD countries)LatviaLeast developed countries: UN classificationLebanonLesothoLiberiaLibyaLithuaniaLow & middle incomeLow incomeLower middle incomeLuxembourgMacao SAR, ChinaMacedonia, FYRMadagascarMalawiMalaysiaMaldivesMaliMaltaMarshall IslandsMauritaniaMauritiusMexicoMicronesia, Fed. Sts.Middle East & North AfricaMiddle East & North Africa (excluding high income)Middle East & North Africa (IDA & IBRD countries)Middle incomeMoldovaMongoliaMontenegroMoroccoMozambiqueMyanmarNamibiaNepalNetherlandsNew CaledoniaNew ZealandNicaraguaNigerNigeriaNorth AmericaNorwayOECD membersOmanOther small statesPacific island small statesPakistanPalauPanamaPapua New GuineaParaguayPeruPhilippinesPolandPortugalPost-demographic dividendPre-demographic dividendQatarRomaniaRussian FederationRwandaSamoaSao Tome and PrincipeSaudi ArabiaSenegalSerbiaSeychellesSierra LeoneSingaporeSint Maarten (Dutch part)Slovak RepublicSloveniaSmall statesSolomon IslandsSouth AfricaSouth AsiaSouth Asia (IDA & IBRD)South SudanSpainSri LankaSt. Kitts and NevisSt. LuciaSt. Vincent and the GrenadinesSub-Saharan Africa Sub-Saharan Africa (excluding high income)Sub-Saharan Africa (IDA & IBRD countries)SudanSurinameSwazilandSwedenSwitzerlandSyrian Arab RepublicTajikistanTanzaniaThailandTimor-LesteTogoTongaTrinidad and TobagoTunisiaTurkeyTuvaluUgandaUkraineUnited KingdomUnited StatesUpper middle incomeUruguayVanuatuVenezuela, RBWest Bank and GazaWorldYemen, Rep.ZambiaZimbabwe Timeline:
This timeline shows a graph from 1986 to 2015 of Least developed countries: UN classification. No data until 1985. Number of actual observations by date: 30.
Source name:
World Development Indicators
Source organization:
International Monetary Fund, Balance of Payments Statistics Yearbook and data files.
Categories, topics:
Economy & Growth, Trade
Last updated:
apr 23, 2017
Indicators value changes by year
Maximum:
15.832
jan 1, 2001
At the date of observation
Value
Absolute change
Change from previous value
jan 1, 1986
10.031
+10.031
0.0%
jan 1, 1987
11.277
+1.246
12.42%
jan 1, 1988
12.634
+1.356
12.03%
jan 1, 1989
13.038
+0.404
3.2%
jan 1, 1990
13.773
+0.735
5.64%
jan 1, 1991
11.124
-2.649
-19.23%
jan 1, 1992
11.892
+0.768
6.91%
jan 1, 1993
11.771
-0.122
-1.02%
jan 1, 1994
13.338
+1.567
13.32%
jan 1, 1995
15.406
+2.068
15.5%
jan 1, 1996
14.895
-0.511
-3.31%
jan 1, 1997
14.715
-0.181
-1.21%
jan 1, 1998
14.738
+0.024
0.16%
jan 1, 1999
14.408
-0.33
-2.24%
jan 1, 2000
14.514
+0.105
0.73%
jan 1, 2001
15.832
+1.319
9.09%
jan 1, 2002
12.581
-3.252
-20.54%
jan 1, 2003
12.587
+0.006
0.05%
jan 1, 2004
12.362
-0.225
-1.79%
jan 1, 2005
12.259
-0.102
-0.83%
jan 1, 2006
13.212
+0.952
7.77%
jan 1, 2007
14.889
+1.677
12.69%
jan 1, 2008
12.938
-1.95
-13.1%
jan 1, 2009
15.2
+2.262
17.48%
jan 1, 2010
10.275
-4.926
-32.41%
jan 1, 2011
10.651
+0.376
3.66%
jan 1, 2012
9.625
-1.025
-9.63%
jan 1, 2013
8.836
-0.79
-8.21%
jan 1, 2014
8.932
+0.096
1.09%
jan 1, 2015
8.372
-0.559
-6.26%
Ranking of countries by current statistics by years


Comments: