29
/
en
AIzaSyAYiBZKx7MnpbEhh9jyipgxe19OcubqV5w
April 1, 2024
192009
Malta
MLT
true
2
1
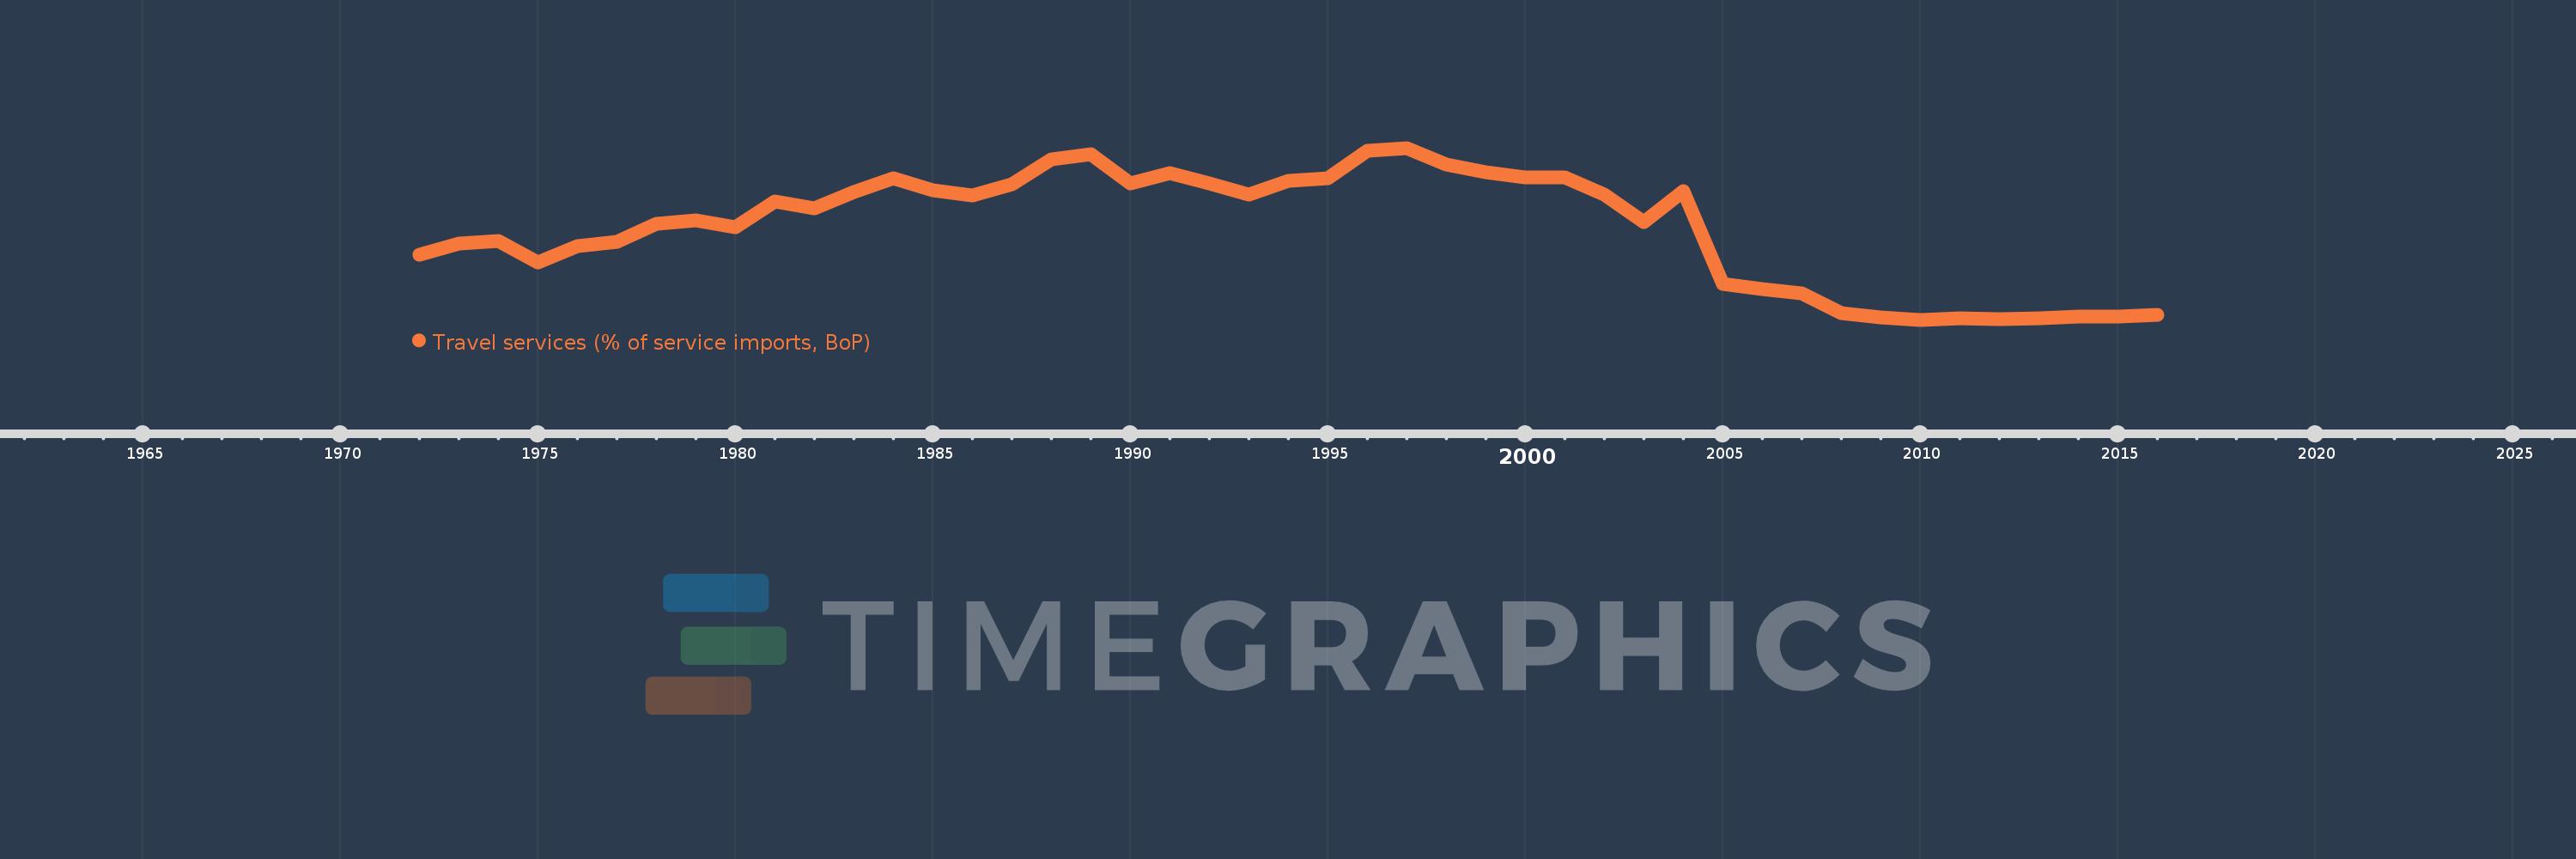
Travel services (% of service imports, BoP)
2016,2015,2014,2013,2012,2011,2010,2009,2008,2007,2006,2005,2004,2003,2002,2001,2000,1999,1998,1997,1996,1995,1994,1993,1992,1991,1990,1989,1988,1987,1986,1985,1984,1983,1982,1981,1980,1979,1978,1977,1976,1975,1974,1973,1972
This statistics in other country:
AfghanistanAlbaniaAlgeriaAngolaAntigua and BarbudaArab WorldArgentinaArmeniaArubaAustraliaAustriaAzerbaijanBahamas, TheBahrainBangladeshBarbadosBelarusBelgiumBelizeBeninBermudaBhutanBoliviaBosnia and HerzegovinaBotswanaBrazilBrunei DarussalamBulgariaBurkina FasoBurundiCabo VerdeCambodiaCameroonCanadaCaribbean small statesCentral African RepublicCentral Europe and the BalticsChadChileChinaColombiaComorosCongo, Dem. Rep.Congo, Rep.Costa RicaCote d'IvoireCroatiaCuracaoCyprusCzech RepublicDenmarkDjiboutiDominicaDominican RepublicEarly-demographic dividendEast Asia & PacificEast Asia & Pacific (excluding high income)East Asia & Pacific (IDA & IBRD countries)EcuadorEgypt, Arab Rep.El SalvadorEritreaEstoniaEthiopiaEuro areaEurope & Central AsiaEurope & Central Asia (excluding high income)Europe & Central Asia (IDA & IBRD countries)European UnionFaroe IslandsFijiFinlandFragile and conflict affected situationsFranceFrench PolynesiaGabonGambia, TheGeorgiaGermanyGhanaGreeceGrenadaGuatemalaGuineaGuinea-BissauGuyanaHaitiHeavily indebted poor countries (HIPC)High incomeHondurasHong Kong SAR, ChinaHungaryIBRD onlyIcelandIDA & IBRD totalIDA onlyIDA totalIndiaIndonesiaIran, Islamic Rep.IraqIrelandIsraelItalyJamaicaJapanJordanKazakhstanKenyaKiribatiKorea, Rep.KosovoKuwaitKyrgyz RepublicLao PDRLate-demographic dividendLatin America & Caribbean Latin America & Caribbean (excluding high income)Latin America & the Caribbean (IDA & IBRD countries)LatviaLeast developed countries: UN classificationLebanonLesothoLiberiaLibyaLithuaniaLow & middle incomeLow incomeLower middle incomeLuxembourgMacao SAR, ChinaMacedonia, FYRMadagascarMalawiMalaysiaMaldivesMaliMaltaMarshall IslandsMauritaniaMauritiusMexicoMicronesia, Fed. Sts.Middle East & North AfricaMiddle East & North Africa (excluding high income)Middle East & North Africa (IDA & IBRD countries)Middle incomeMoldovaMongoliaMontenegroMoroccoMozambiqueMyanmarNamibiaNepalNetherlandsNew CaledoniaNew ZealandNicaraguaNigerNigeriaNorth AmericaNorwayOECD membersOmanOther small statesPacific island small statesPakistanPalauPanamaPapua New GuineaParaguayPeruPhilippinesPolandPortugalPost-demographic dividendPre-demographic dividendQatarRomaniaRussian FederationRwandaSamoaSao Tome and PrincipeSaudi ArabiaSenegalSerbiaSeychellesSierra LeoneSingaporeSint Maarten (Dutch part)Slovak RepublicSloveniaSmall statesSolomon IslandsSouth AfricaSouth AsiaSouth Asia (IDA & IBRD)South SudanSpainSri LankaSt. Kitts and NevisSt. LuciaSt. Vincent and the GrenadinesSub-Saharan Africa Sub-Saharan Africa (excluding high income)Sub-Saharan Africa (IDA & IBRD countries)SudanSurinameSwazilandSwedenSwitzerlandSyrian Arab RepublicTajikistanTanzaniaThailandTimor-LesteTogoTongaTrinidad and TobagoTunisiaTurkeyTuvaluUgandaUkraineUnited KingdomUnited StatesUpper middle incomeUruguayVanuatuVenezuela, RBWest Bank and GazaWorldYemen, Rep.ZambiaZimbabwe Timeline:
This timeline shows a graph from 1972 to 2016 of Malta. No data until 1971. Number of actual observations by date: 45.
Source name:
World Development Indicators
Source organization:
International Monetary Fund, Balance of Payments Statistics Yearbook and data files.
Categories, topics:
Economy & Growth, Trade
Last updated:
apr 23, 2017
Indicators value changes by year
Maximum:
30.213
jan 1, 1997
At the date of observation
Value
Absolute change
Change from previous value
jan 1, 1972
13.529
+13.529
0.0%
jan 1, 1973
15.294
+1.765
13.04%
jan 1, 1974
15.707
+0.413
2.7%
jan 1, 1975
12.411
-3.295
-20.98%
jan 1, 1976
14.935
+2.524
20.33%
jan 1, 1977
15.616
+0.681
4.56%
jan 1, 1978
18.351
+2.734
17.51%
jan 1, 1979
18.889
+0.538
2.93%
jan 1, 1980
17.879
-1.01
-5.35%
jan 1, 1981
21.812
+3.933
22.0%
jan 1, 1982
20.807
-1.005
-4.61%
jan 1, 1983
23.373
+2.566
12.33%
jan 1, 1984
25.446
+2.074
8.87%
jan 1, 1985
23.681
-1.765
-6.94%
jan 1, 1986
22.829
-0.852
-3.6%
jan 1, 1987
24.592
+1.762
7.72%
jan 1, 1988
28.468
+3.876
15.76%
jan 1, 1989
29.179
+0.711
2.5%
jan 1, 1990
24.702
-4.477
-15.34%
jan 1, 1991
26.333
+1.631
6.6%
jan 1, 1992
24.71
-1.622
-6.16%
jan 1, 1993
23.015
-1.695
-6.86%
jan 1, 1994
25.092
+2.077
9.02%
jan 1, 1995
25.465
+0.373
1.49%
jan 1, 1996
29.731
+4.266
16.75%
jan 1, 1997
30.213
+0.482
1.62%
jan 1, 1998
27.65
-2.563
-8.48%
jan 1, 1999
26.452
-1.199
-4.34%
jan 1, 2000
25.663
-0.788
-2.98%
jan 1, 2001
25.609
-0.055
-0.21%
jan 1, 2002
23.011
-2.597
-10.14%
jan 1, 2003
18.642
-4.369
-18.99%
jan 1, 2004
23.441
+4.799
25.74%
jan 1, 2005
9.012
-14.429
-61.56%
jan 1, 2006
8.208
-0.803
-8.91%
jan 1, 2007
7.556
-0.653
-7.95%
jan 1, 2008
4.545
-3.011
-39.85%
jan 1, 2009
3.884
-0.661
-14.53%
jan 1, 2010
3.457
-0.428
-11.02%
jan 1, 2011
3.66
+0.203
5.88%
jan 1, 2012
3.553
-0.106
-2.91%
jan 1, 2013
3.664
+0.111
3.12%
jan 1, 2014
3.888
+0.224
6.1%
jan 1, 2015
3.93
+0.042
1.08%
jan 1, 2016
4.217
+0.287
7.31%
Ranking of countries by current statistics by years


Comments: