29
/
en
AIzaSyAYiBZKx7MnpbEhh9jyipgxe19OcubqV5w
April 1, 2024
151230
Honduras
HND
true
2
1
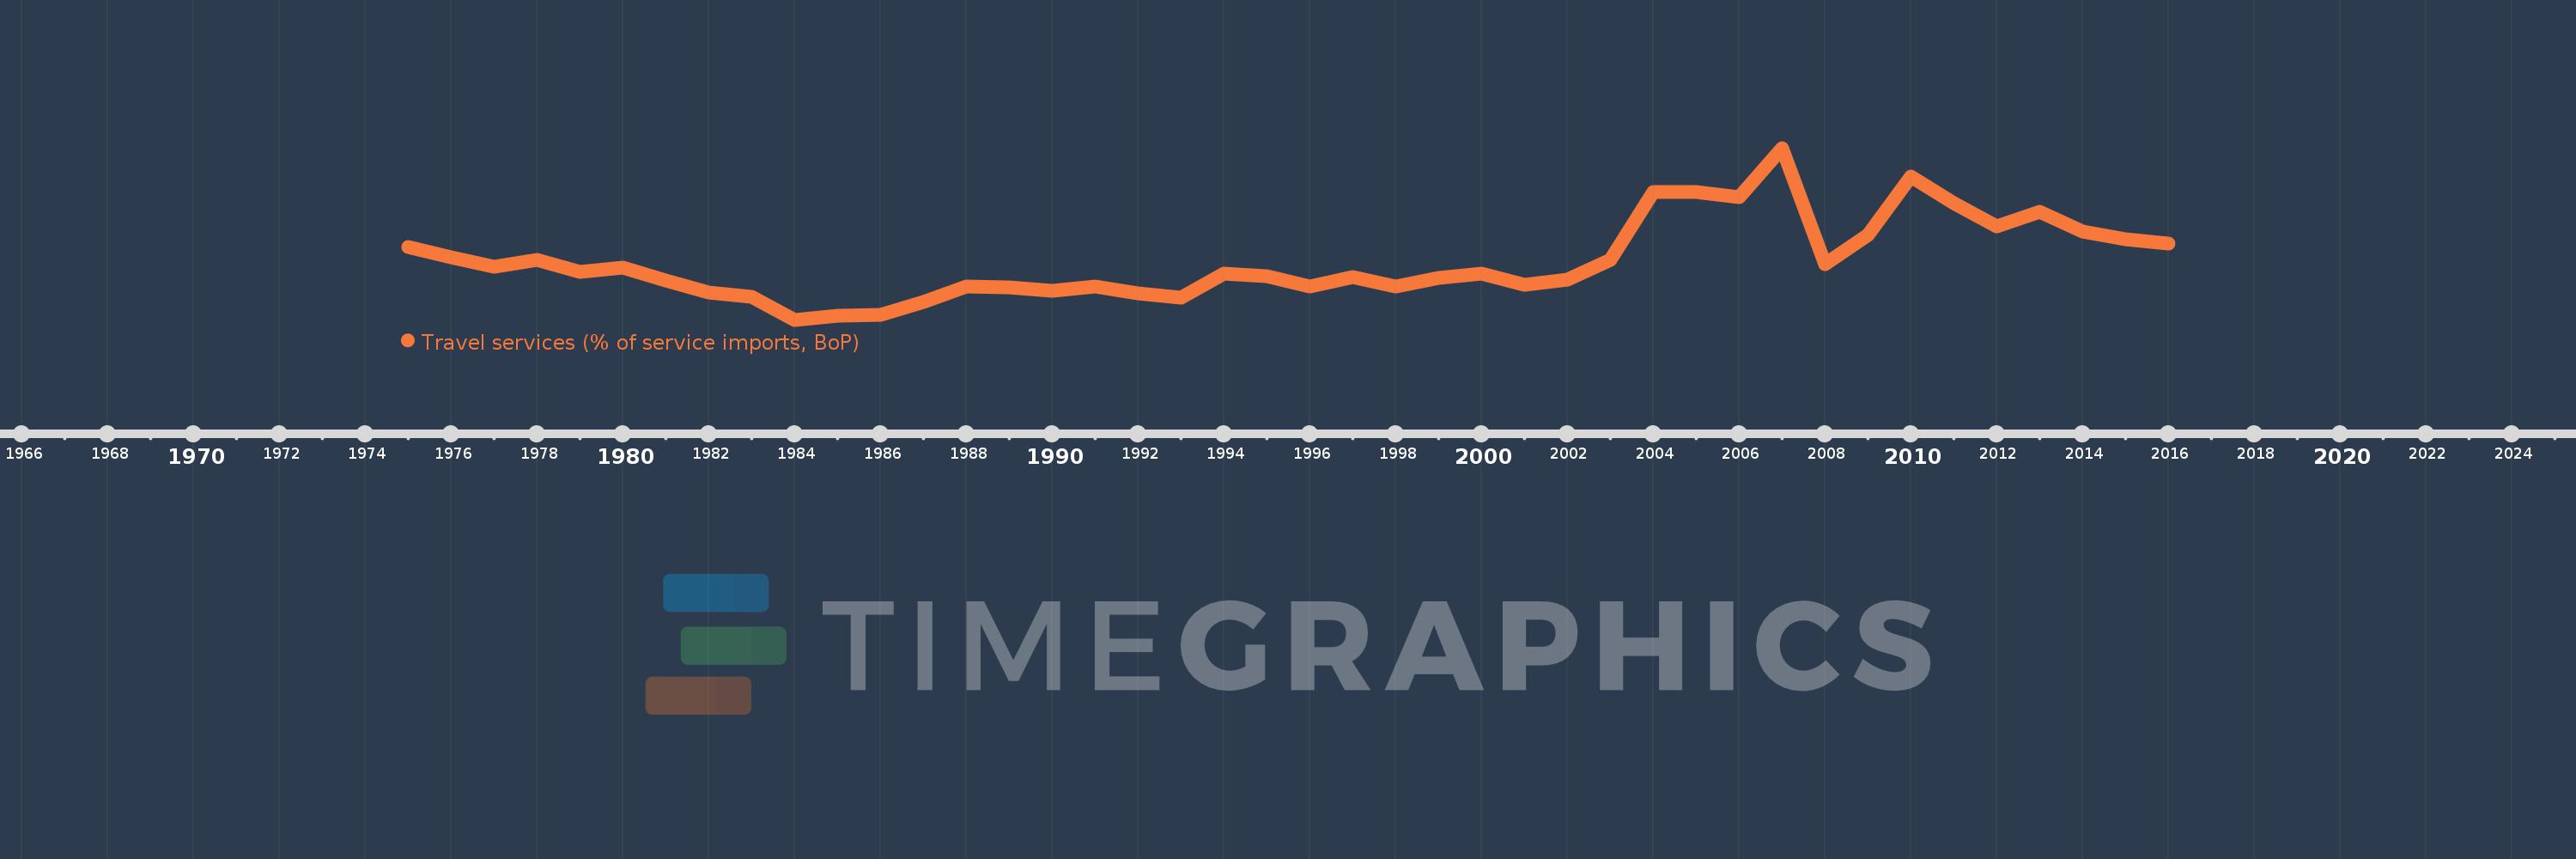
Travel services (% of service imports, BoP)
2016,2015,2014,2013,2012,2011,2010,2009,2008,2007,2006,2005,2004,2003,2002,2001,2000,1999,1998,1997,1996,1995,1994,1993,1992,1991,1990,1989,1988,1987,1986,1985,1984,1983,1982,1981,1980,1979,1978,1977,1976,1975
This statistics in other country:
AfghanistanAlbaniaAlgeriaAngolaAntigua and BarbudaArab WorldArgentinaArmeniaArubaAustraliaAustriaAzerbaijanBahamas, TheBahrainBangladeshBarbadosBelarusBelgiumBelizeBeninBermudaBhutanBoliviaBosnia and HerzegovinaBotswanaBrazilBrunei DarussalamBulgariaBurkina FasoBurundiCabo VerdeCambodiaCameroonCanadaCaribbean small statesCentral African RepublicCentral Europe and the BalticsChadChileChinaColombiaComorosCongo, Dem. Rep.Congo, Rep.Costa RicaCote d'IvoireCroatiaCuracaoCyprusCzech RepublicDenmarkDjiboutiDominicaDominican RepublicEarly-demographic dividendEast Asia & PacificEast Asia & Pacific (excluding high income)East Asia & Pacific (IDA & IBRD countries)EcuadorEgypt, Arab Rep.El SalvadorEritreaEstoniaEthiopiaEuro areaEurope & Central AsiaEurope & Central Asia (excluding high income)Europe & Central Asia (IDA & IBRD countries)European UnionFaroe IslandsFijiFinlandFragile and conflict affected situationsFranceFrench PolynesiaGabonGambia, TheGeorgiaGermanyGhanaGreeceGrenadaGuatemalaGuineaGuinea-BissauGuyanaHaitiHeavily indebted poor countries (HIPC)High incomeHondurasHong Kong SAR, ChinaHungaryIBRD onlyIcelandIDA & IBRD totalIDA onlyIDA totalIndiaIndonesiaIran, Islamic Rep.IraqIrelandIsraelItalyJamaicaJapanJordanKazakhstanKenyaKiribatiKorea, Rep.KosovoKuwaitKyrgyz RepublicLao PDRLate-demographic dividendLatin America & Caribbean Latin America & Caribbean (excluding high income)Latin America & the Caribbean (IDA & IBRD countries)LatviaLeast developed countries: UN classificationLebanonLesothoLiberiaLibyaLithuaniaLow & middle incomeLow incomeLower middle incomeLuxembourgMacao SAR, ChinaMacedonia, FYRMadagascarMalawiMalaysiaMaldivesMaliMaltaMarshall IslandsMauritaniaMauritiusMexicoMicronesia, Fed. Sts.Middle East & North AfricaMiddle East & North Africa (excluding high income)Middle East & North Africa (IDA & IBRD countries)Middle incomeMoldovaMongoliaMontenegroMoroccoMozambiqueMyanmarNamibiaNepalNetherlandsNew CaledoniaNew ZealandNicaraguaNigerNigeriaNorth AmericaNorwayOECD membersOmanOther small statesPacific island small statesPakistanPalauPanamaPapua New GuineaParaguayPeruPhilippinesPolandPortugalPost-demographic dividendPre-demographic dividendQatarRomaniaRussian FederationRwandaSamoaSao Tome and PrincipeSaudi ArabiaSenegalSerbiaSeychellesSierra LeoneSingaporeSint Maarten (Dutch part)Slovak RepublicSloveniaSmall statesSolomon IslandsSouth AfricaSouth AsiaSouth Asia (IDA & IBRD)South SudanSpainSri LankaSt. Kitts and NevisSt. LuciaSt. Vincent and the GrenadinesSub-Saharan Africa Sub-Saharan Africa (excluding high income)Sub-Saharan Africa (IDA & IBRD countries)SudanSurinameSwazilandSwedenSwitzerlandSyrian Arab RepublicTajikistanTanzaniaThailandTimor-LesteTogoTongaTrinidad and TobagoTunisiaTurkeyTuvaluUgandaUkraineUnited KingdomUnited StatesUpper middle incomeUruguayVanuatuVenezuela, RBWest Bank and GazaWorldYemen, Rep.ZambiaZimbabwe Timeline:
This timeline shows a graph from 1975 to 2016 of Honduras. No data until 1974. Number of actual observations by date: 42.
Source name:
World Development Indicators
Source organization:
International Monetary Fund, Balance of Payments Statistics Yearbook and data files.
Categories, topics:
Economy & Growth, Trade
Last updated:
apr 23, 2017
Indicators value changes by year
Minimum:
12.946
jan 1, 1984
Maximum:
34.271
jan 1, 2007
At the date of observation
Value
Absolute change
Change from previous value
jan 1, 1975
21.962
+21.962
0.0%
jan 1, 1976
20.746
-1.216
-5.54%
jan 1, 1977
19.537
-1.208
-5.82%
jan 1, 1978
20.398
+0.861
4.41%
jan 1, 1979
18.846
-1.552
-7.61%
jan 1, 1980
19.366
+0.519
2.76%
jan 1, 1981
17.821
-1.545
-7.98%
jan 1, 1982
16.346
-1.475
-8.28%
jan 1, 1983
15.841
-0.505
-3.09%
jan 1, 1984
12.946
-2.895
-18.27%
jan 1, 1985
13.459
+0.513
3.96%
jan 1, 1986
13.569
+0.11
0.82%
jan 1, 1987
15.106
+1.537
11.33%
jan 1, 1988
17.043
+1.937
12.82%
jan 1, 1989
17.011
-0.031
-0.18%
jan 1, 1990
16.486
-0.526
-3.09%
jan 1, 1991
17.061
+0.575
3.49%
jan 1, 1992
16.233
-0.828
-4.85%
jan 1, 1993
15.707
-0.526
-3.24%
jan 1, 1994
18.663
+2.956
18.82%
jan 1, 1995
18.328
-0.335
-1.8%
jan 1, 1996
17.081
-1.247
-6.8%
jan 1, 1997
18.209
+1.128
6.6%
jan 1, 1998
17.117
-1.093
-6.0%
jan 1, 1999
18.129
+1.012
5.91%
jan 1, 2000
18.71
+0.581
3.21%
jan 1, 2001
17.237
-1.473
-7.87%
jan 1, 2002
17.908
+0.671
3.89%
jan 1, 2003
20.376
+2.468
13.78%
jan 1, 2004
28.774
+8.397
41.21%
jan 1, 2005
28.756
-0.018
-0.06%
jan 1, 2006
28.211
-0.545
-1.9%
jan 1, 2007
34.271
+6.06
21.48%
jan 1, 2008
19.836
-14.434
-42.12%
jan 1, 2009
23.459
+3.622
18.26%
jan 1, 2010
30.707
+7.248
30.9%
jan 1, 2011
27.44
-3.267
-10.64%
jan 1, 2012
24.505
-2.935
-10.7%
jan 1, 2013
26.375
+1.87
7.63%
jan 1, 2014
23.92
-2.455
-9.31%
jan 1, 2015
22.985
-0.935
-3.91%
jan 1, 2016
22.45
-0.535
-2.33%
Ranking of countries by current statistics by years


Comments: