29
/
en
AIzaSyAYiBZKx7MnpbEhh9jyipgxe19OcubqV5w
April 1, 2024
113107
Costa Rica
CRI
true
2
1
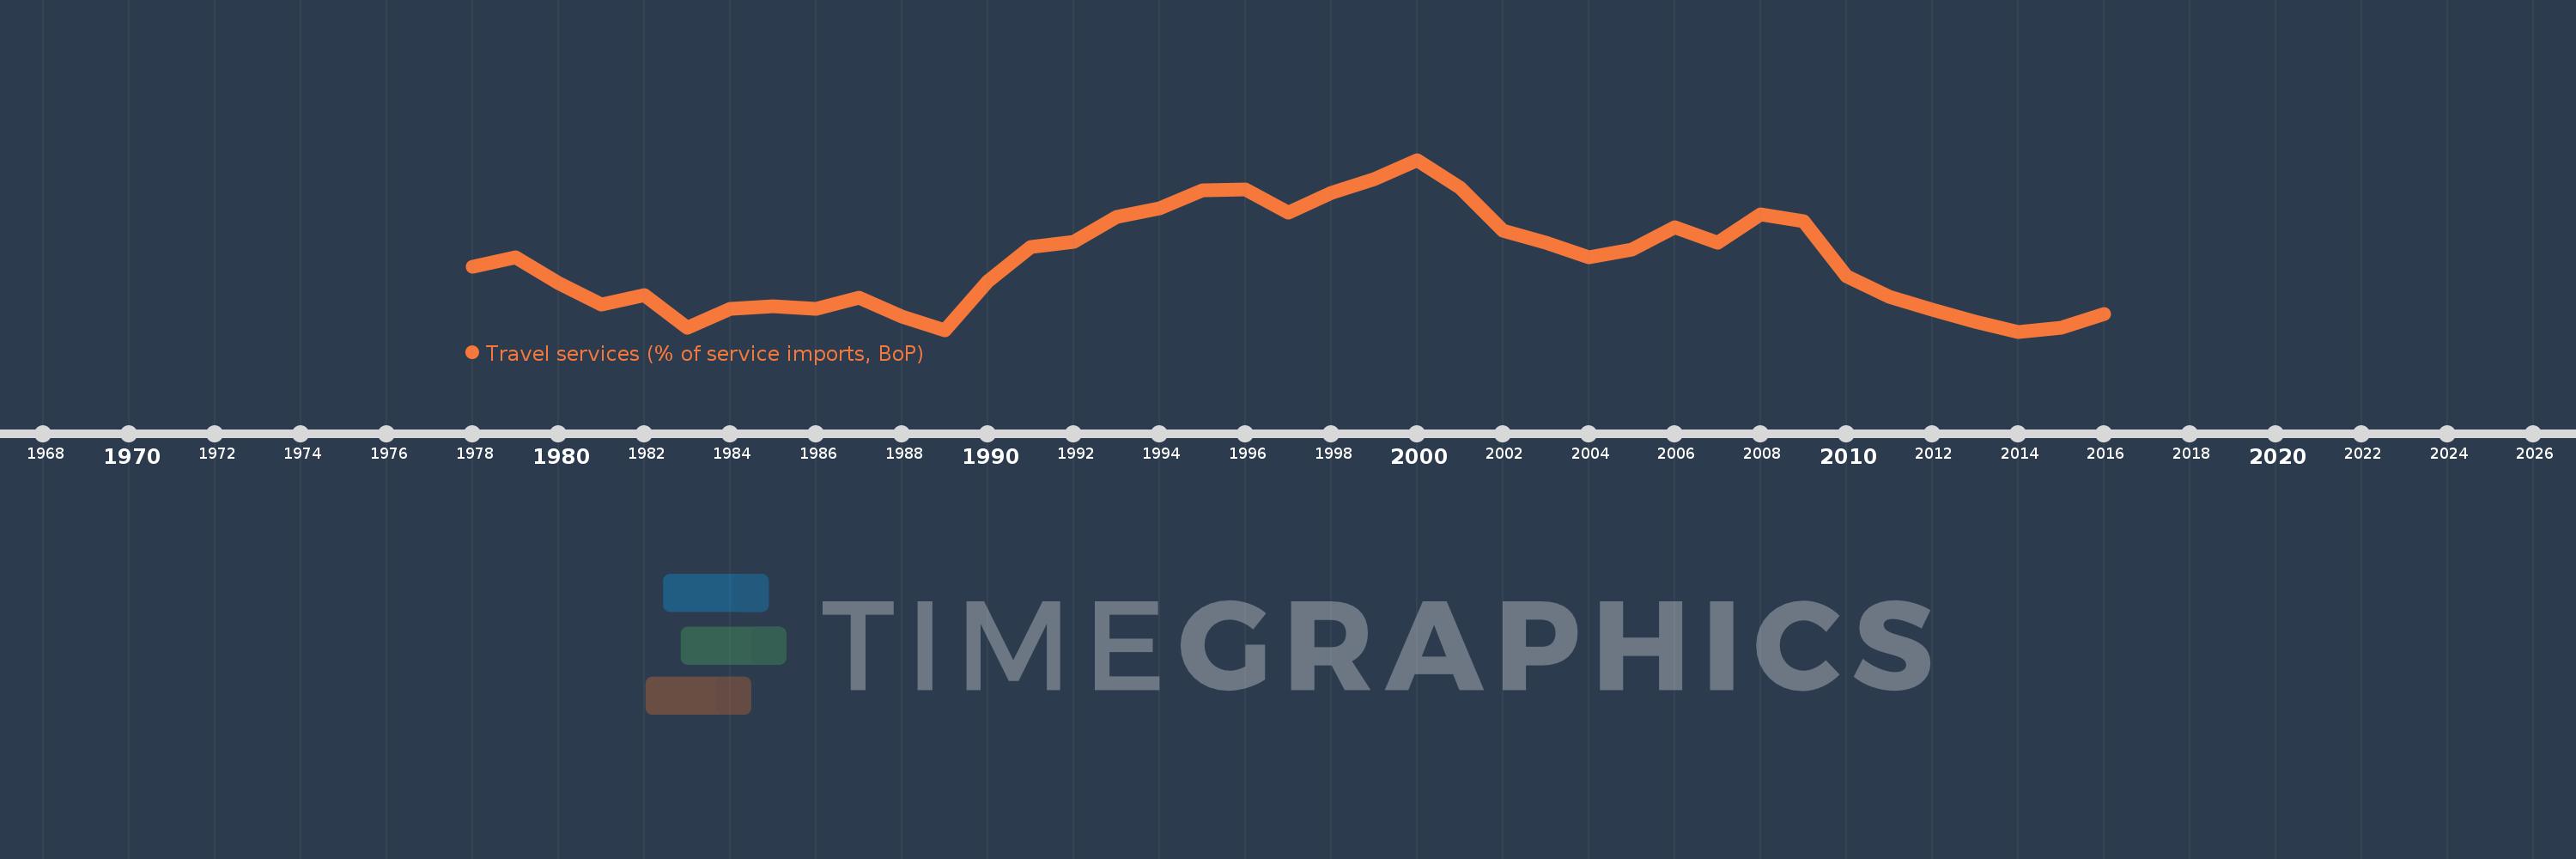
Travel services (% of service imports, BoP)
2016,2015,2014,2013,2012,2011,2010,2009,2008,2007,2006,2005,2004,2003,2002,2001,2000,1999,1998,1997,1996,1995,1994,1993,1992,1991,1990,1989,1988,1987,1986,1985,1984,1983,1982,1981,1980,1979,1978
This statistics in other country:
AfghanistanAlbaniaAlgeriaAngolaAntigua and BarbudaArab WorldArgentinaArmeniaArubaAustraliaAustriaAzerbaijanBahamas, TheBahrainBangladeshBarbadosBelarusBelgiumBelizeBeninBermudaBhutanBoliviaBosnia and HerzegovinaBotswanaBrazilBrunei DarussalamBulgariaBurkina FasoBurundiCabo VerdeCambodiaCameroonCanadaCaribbean small statesCentral African RepublicCentral Europe and the BalticsChadChileChinaColombiaComorosCongo, Dem. Rep.Congo, Rep.Costa RicaCote d'IvoireCroatiaCuracaoCyprusCzech RepublicDenmarkDjiboutiDominicaDominican RepublicEarly-demographic dividendEast Asia & PacificEast Asia & Pacific (excluding high income)East Asia & Pacific (IDA & IBRD countries)EcuadorEgypt, Arab Rep.El SalvadorEritreaEstoniaEthiopiaEuro areaEurope & Central AsiaEurope & Central Asia (excluding high income)Europe & Central Asia (IDA & IBRD countries)European UnionFaroe IslandsFijiFinlandFragile and conflict affected situationsFranceFrench PolynesiaGabonGambia, TheGeorgiaGermanyGhanaGreeceGrenadaGuatemalaGuineaGuinea-BissauGuyanaHaitiHeavily indebted poor countries (HIPC)High incomeHondurasHong Kong SAR, ChinaHungaryIBRD onlyIcelandIDA & IBRD totalIDA onlyIDA totalIndiaIndonesiaIran, Islamic Rep.IraqIrelandIsraelItalyJamaicaJapanJordanKazakhstanKenyaKiribatiKorea, Rep.KosovoKuwaitKyrgyz RepublicLao PDRLate-demographic dividendLatin America & Caribbean Latin America & Caribbean (excluding high income)Latin America & the Caribbean (IDA & IBRD countries)LatviaLeast developed countries: UN classificationLebanonLesothoLiberiaLibyaLithuaniaLow & middle incomeLow incomeLower middle incomeLuxembourgMacao SAR, ChinaMacedonia, FYRMadagascarMalawiMalaysiaMaldivesMaliMaltaMarshall IslandsMauritaniaMauritiusMexicoMicronesia, Fed. Sts.Middle East & North AfricaMiddle East & North Africa (excluding high income)Middle East & North Africa (IDA & IBRD countries)Middle incomeMoldovaMongoliaMontenegroMoroccoMozambiqueMyanmarNamibiaNepalNetherlandsNew CaledoniaNew ZealandNicaraguaNigerNigeriaNorth AmericaNorwayOECD membersOmanOther small statesPacific island small statesPakistanPalauPanamaPapua New GuineaParaguayPeruPhilippinesPolandPortugalPost-demographic dividendPre-demographic dividendQatarRomaniaRussian FederationRwandaSamoaSao Tome and PrincipeSaudi ArabiaSenegalSerbiaSeychellesSierra LeoneSingaporeSint Maarten (Dutch part)Slovak RepublicSloveniaSmall statesSolomon IslandsSouth AfricaSouth AsiaSouth Asia (IDA & IBRD)South SudanSpainSri LankaSt. Kitts and NevisSt. LuciaSt. Vincent and the GrenadinesSub-Saharan Africa Sub-Saharan Africa (excluding high income)Sub-Saharan Africa (IDA & IBRD countries)SudanSurinameSwazilandSwedenSwitzerlandSyrian Arab RepublicTajikistanTanzaniaThailandTimor-LesteTogoTongaTrinidad and TobagoTunisiaTurkeyTuvaluUgandaUkraineUnited KingdomUnited StatesUpper middle incomeUruguayVanuatuVenezuela, RBWest Bank and GazaWorldYemen, Rep.ZambiaZimbabwe Timeline:
This timeline shows a graph from 1978 to 2016 of Costa Rica. No data until 1977. Number of actual observations by date: 39.
Source name:
World Development Indicators
Source organization:
International Monetary Fund, Balance of Payments Statistics Yearbook and data files.
Categories, topics:
Economy & Growth, Trade
Last updated:
apr 23, 2017
Indicators value changes by year
Minimum:
17.808
jan 1, 2014
Maximum:
39.005
jan 1, 2000
At the date of observation
Value
Absolute change
Change from previous value
jan 1, 1978
25.829
+25.829
0.0%
jan 1, 1979
26.935
+1.106
4.28%
jan 1, 1980
23.763
-3.172
-11.78%
jan 1, 1981
21.104
-2.659
-11.19%
jan 1, 1982
22.35
+1.246
5.9%
jan 1, 1983
18.269
-4.081
-18.26%
jan 1, 1984
20.639
+2.37
12.98%
jan 1, 1985
20.934
+0.294
1.43%
jan 1, 1986
20.589
-0.345
-1.65%
jan 1, 1987
21.97
+1.38
6.7%
jan 1, 1988
19.714
-2.256
-10.27%
jan 1, 1989
17.984
-1.729
-8.77%
jan 1, 1990
24.052
+6.068
33.74%
jan 1, 1991
28.288
+4.236
17.61%
jan 1, 1992
28.833
+0.545
1.93%
jan 1, 1993
31.987
+3.154
10.94%
jan 1, 1994
33.035
+1.048
3.28%
jan 1, 1995
35.263
+2.228
6.74%
jan 1, 1996
35.3
+0.037
0.1%
jan 1, 1997
32.469
-2.831
-8.02%
jan 1, 1998
34.931
+2.462
7.58%
jan 1, 1999
36.581
+1.65
4.72%
jan 1, 2000
39.005
+2.423
6.62%
jan 1, 2001
35.539
-3.465
-8.88%
jan 1, 2002
30.282
-5.257
-14.79%
jan 1, 2003
28.748
-1.534
-5.07%
jan 1, 2004
27.008
-1.74
-6.05%
jan 1, 2005
27.895
+0.887
3.29%
jan 1, 2006
30.653
+2.758
9.89%
jan 1, 2007
28.735
-1.919
-6.26%
jan 1, 2008
32.303
+3.568
12.42%
jan 1, 2009
31.409
-0.894
-2.77%
jan 1, 2010
24.605
-6.804
-21.66%
jan 1, 2011
22.124
-2.48
-10.08%
jan 1, 2012
20.521
-1.603
-7.25%
jan 1, 2013
18.975
-1.546
-7.54%
jan 1, 2014
17.808
-1.167
-6.15%
jan 1, 2015
18.306
+0.498
2.8%
jan 1, 2016
19.969
+1.663
9.09%
Ranking of countries by current statistics by years


Comments: