29
/
en
AIzaSyAYiBZKx7MnpbEhh9jyipgxe19OcubqV5w
April 1, 2024
251496
St. Lucia
LCA
true
2
1
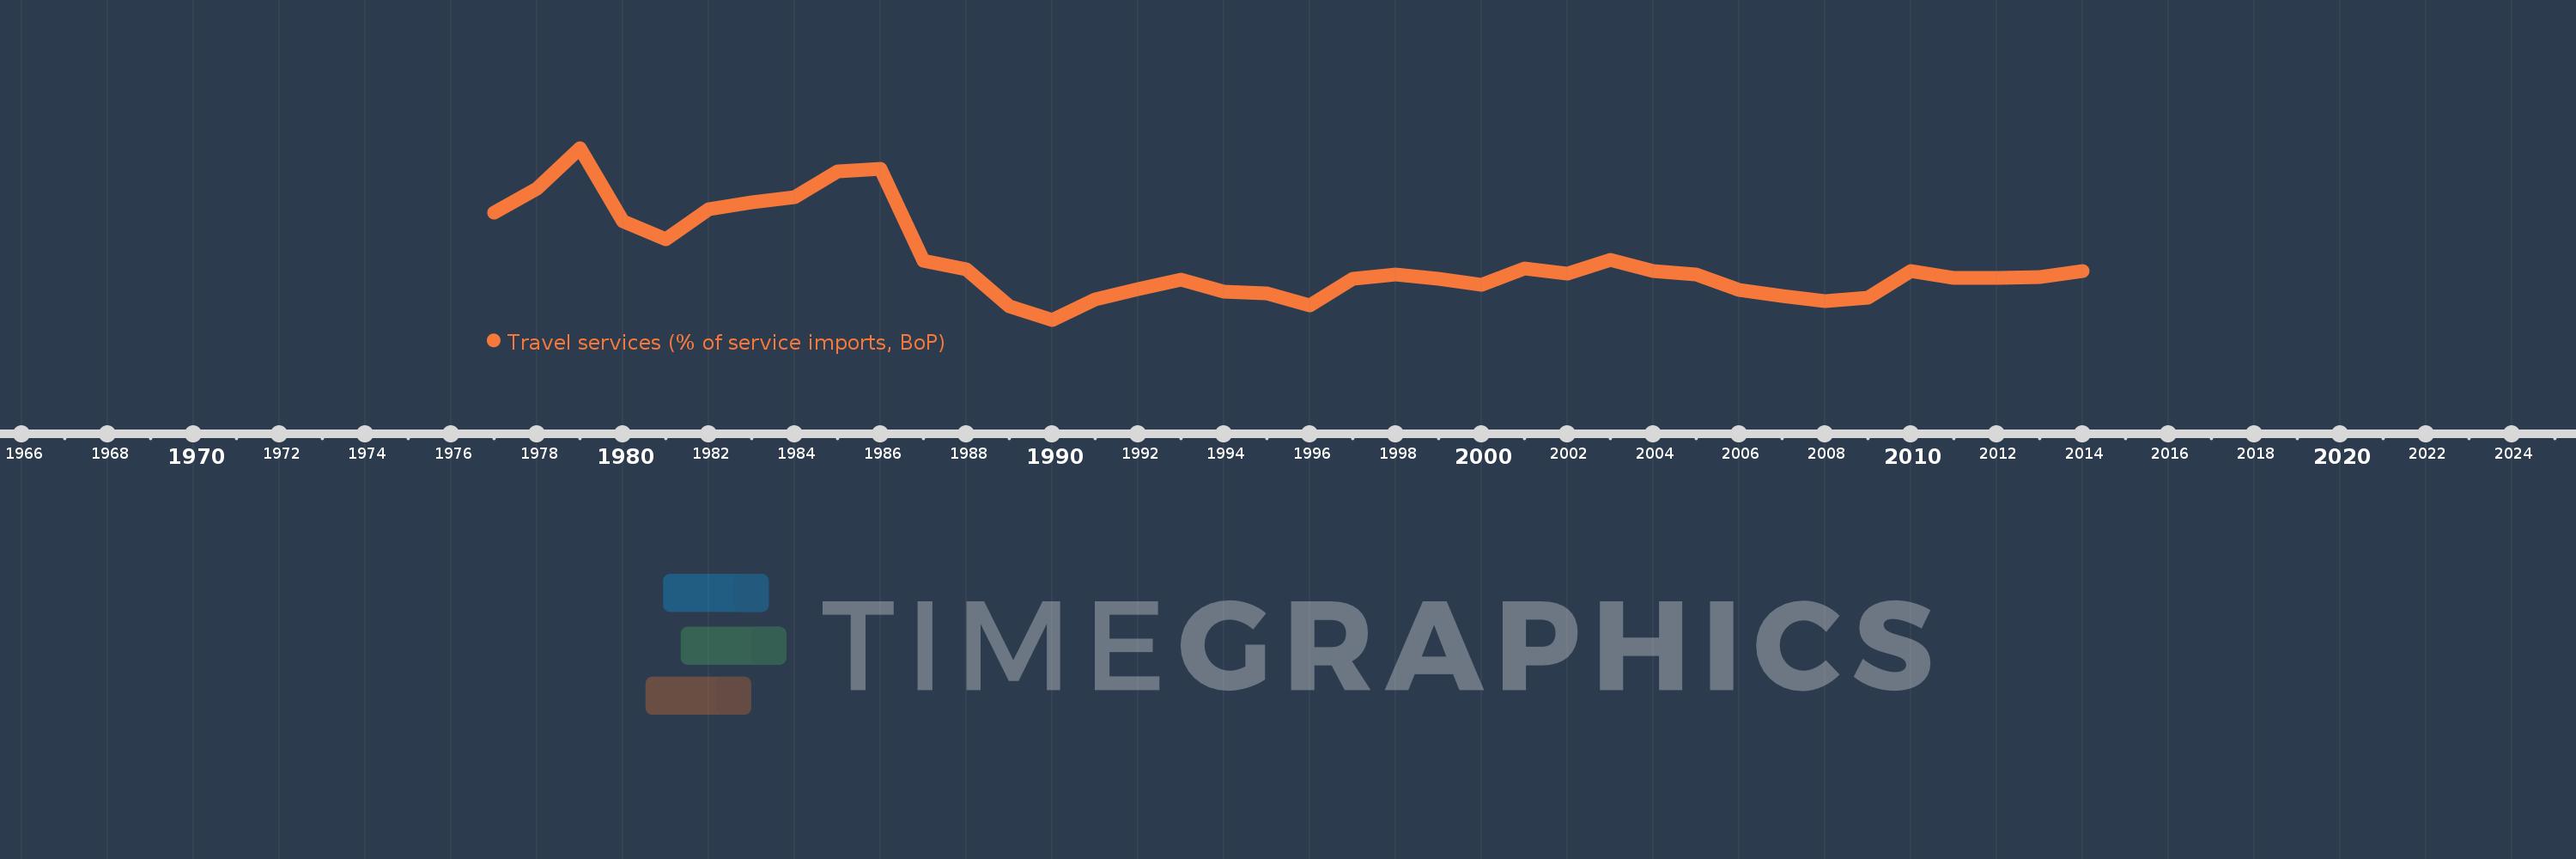
Travel services (% of service imports, BoP)
2014,2013,2012,2011,2010,2009,2008,2007,2006,2005,2004,2003,2002,2001,2000,1999,1998,1997,1996,1995,1994,1993,1992,1991,1990,1989,1988,1987,1986,1985,1984,1983,1982,1981,1980,1979,1978,1977
This statistics in other country:
AfghanistanAlbaniaAlgeriaAngolaAntigua and BarbudaArab WorldArgentinaArmeniaArubaAustraliaAustriaAzerbaijanBahamas, TheBahrainBangladeshBarbadosBelarusBelgiumBelizeBeninBermudaBhutanBoliviaBosnia and HerzegovinaBotswanaBrazilBrunei DarussalamBulgariaBurkina FasoBurundiCabo VerdeCambodiaCameroonCanadaCaribbean small statesCentral African RepublicCentral Europe and the BalticsChadChileChinaColombiaComorosCongo, Dem. Rep.Congo, Rep.Costa RicaCote d'IvoireCroatiaCuracaoCyprusCzech RepublicDenmarkDjiboutiDominicaDominican RepublicEarly-demographic dividendEast Asia & PacificEast Asia & Pacific (excluding high income)East Asia & Pacific (IDA & IBRD countries)EcuadorEgypt, Arab Rep.El SalvadorEritreaEstoniaEthiopiaEuro areaEurope & Central AsiaEurope & Central Asia (excluding high income)Europe & Central Asia (IDA & IBRD countries)European UnionFaroe IslandsFijiFinlandFragile and conflict affected situationsFranceFrench PolynesiaGabonGambia, TheGeorgiaGermanyGhanaGreeceGrenadaGuatemalaGuineaGuinea-BissauGuyanaHaitiHeavily indebted poor countries (HIPC)High incomeHondurasHong Kong SAR, ChinaHungaryIBRD onlyIcelandIDA & IBRD totalIDA onlyIDA totalIndiaIndonesiaIran, Islamic Rep.IraqIrelandIsraelItalyJamaicaJapanJordanKazakhstanKenyaKiribatiKorea, Rep.KosovoKuwaitKyrgyz RepublicLao PDRLate-demographic dividendLatin America & Caribbean Latin America & Caribbean (excluding high income)Latin America & the Caribbean (IDA & IBRD countries)LatviaLeast developed countries: UN classificationLebanonLesothoLiberiaLibyaLithuaniaLow & middle incomeLow incomeLower middle incomeLuxembourgMacao SAR, ChinaMacedonia, FYRMadagascarMalawiMalaysiaMaldivesMaliMaltaMarshall IslandsMauritaniaMauritiusMexicoMicronesia, Fed. Sts.Middle East & North AfricaMiddle East & North Africa (excluding high income)Middle East & North Africa (IDA & IBRD countries)Middle incomeMoldovaMongoliaMontenegroMoroccoMozambiqueMyanmarNamibiaNepalNetherlandsNew CaledoniaNew ZealandNicaraguaNigerNigeriaNorth AmericaNorwayOECD membersOmanOther small statesPacific island small statesPakistanPalauPanamaPapua New GuineaParaguayPeruPhilippinesPolandPortugalPost-demographic dividendPre-demographic dividendQatarRomaniaRussian FederationRwandaSamoaSao Tome and PrincipeSaudi ArabiaSenegalSerbiaSeychellesSierra LeoneSingaporeSint Maarten (Dutch part)Slovak RepublicSloveniaSmall statesSolomon IslandsSouth AfricaSouth AsiaSouth Asia (IDA & IBRD)South SudanSpainSri LankaSt. Kitts and NevisSt. LuciaSt. Vincent and the GrenadinesSub-Saharan Africa Sub-Saharan Africa (excluding high income)Sub-Saharan Africa (IDA & IBRD countries)SudanSurinameSwazilandSwedenSwitzerlandSyrian Arab RepublicTajikistanTanzaniaThailandTimor-LesteTogoTongaTrinidad and TobagoTunisiaTurkeyTuvaluUgandaUkraineUnited KingdomUnited StatesUpper middle incomeUruguayVanuatuVenezuela, RBWest Bank and GazaWorldYemen, Rep.ZambiaZimbabwe Timeline:
This timeline shows a graph from 1977 to 2014 of St. Lucia. No data until 1976. Number of actual observations by date: 38.
Source name:
World Development Indicators
Source organization:
International Monetary Fund, Balance of Payments Statistics Yearbook and data files.
Categories, topics:
Economy & Growth, Trade
Last updated:
apr 23, 2017
Indicators value changes by year
Minimum:
17.994
jan 1, 1990
Maximum:
41.299
jan 1, 1979
At the date of observation
Value
Absolute change
Change from previous value
jan 1, 1977
32.485
+32.485
0.0%
jan 1, 1978
35.73
+3.245
9.99%
jan 1, 1979
41.299
+5.569
15.59%
jan 1, 1980
31.326
-9.973
-24.15%
jan 1, 1981
28.891
-2.434
-7.77%
jan 1, 1982
33.015
+4.123
14.27%
jan 1, 1983
33.876
+0.862
2.61%
jan 1, 1984
34.645
+0.769
2.27%
jan 1, 1985
38.135
+3.49
10.07%
jan 1, 1986
38.447
+0.312
0.82%
jan 1, 1987
26.023
-12.424
-32.31%
jan 1, 1988
24.839
-1.185
-4.55%
jan 1, 1989
19.84
-4.999
-20.13%
jan 1, 1990
17.994
-1.845
-9.3%
jan 1, 1991
20.785
+2.791
15.51%
jan 1, 1992
22.13
+1.344
6.47%
jan 1, 1993
23.413
+1.283
5.8%
jan 1, 1994
21.831
-1.581
-6.75%
jan 1, 1995
21.612
-0.219
-1.0%
jan 1, 1996
19.975
-1.637
-7.58%
jan 1, 1997
23.504
+3.529
17.67%
jan 1, 1998
24.187
+0.683
2.91%
jan 1, 1999
23.598
-0.589
-2.44%
jan 1, 2000
22.704
-0.894
-3.79%
jan 1, 2001
24.949
+2.245
9.89%
jan 1, 2002
24.309
-0.639
-2.56%
jan 1, 2003
26.132
+1.823
7.5%
jan 1, 2004
24.567
-1.565
-5.99%
jan 1, 2005
24.183
-0.384
-1.56%
jan 1, 2006
22.023
-2.16
-8.93%
jan 1, 2007
21.182
-0.841
-3.82%
jan 1, 2008
20.55
-0.632
-2.98%
jan 1, 2009
21.02
+0.47
2.29%
jan 1, 2010
24.596
+3.576
17.01%
jan 1, 2011
23.615
-0.981
-3.99%
jan 1, 2012
23.613
-0.002
-0.01%
jan 1, 2013
23.767
+0.154
0.65%
jan 1, 2014
24.582
+0.815
3.43%
Ranking of countries by current statistics by years


Comments: