29
/
en
AIzaSyAYiBZKx7MnpbEhh9jyipgxe19OcubqV5w
April 1, 2024
277226
United States
USA
true
2
1
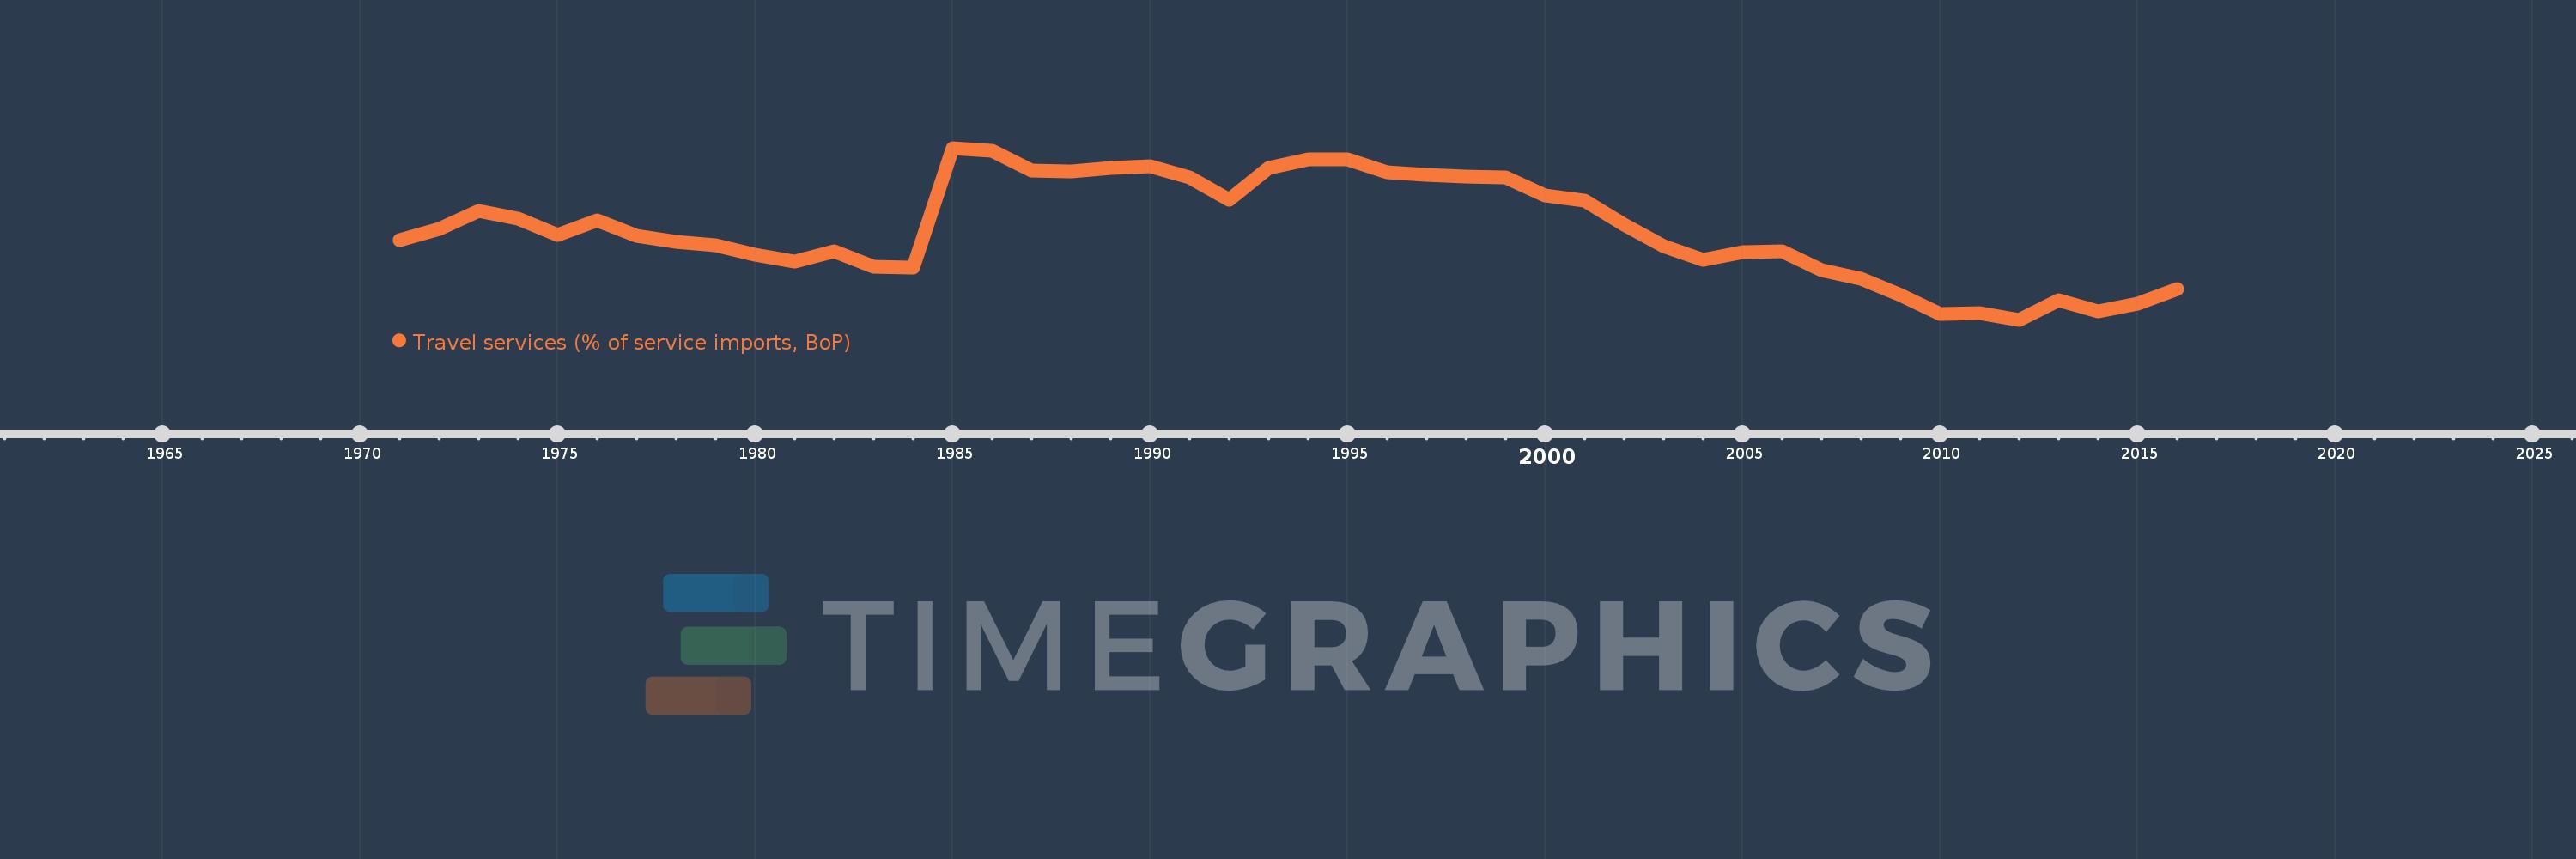
Travel services (% of service imports, BoP)
2016,2015,2014,2013,2012,2011,2010,2009,2008,2007,2006,2005,2004,2003,2002,2001,2000,1999,1998,1997,1996,1995,1994,1993,1992,1991,1990,1989,1988,1987,1986,1985,1984,1983,1982,1981,1980,1979,1978,1977,1976,1975,1974,1973,1972,1971
This statistics in other country:
AfghanistanAlbaniaAlgeriaAngolaAntigua and BarbudaArab WorldArgentinaArmeniaArubaAustraliaAustriaAzerbaijanBahamas, TheBahrainBangladeshBarbadosBelarusBelgiumBelizeBeninBermudaBhutanBoliviaBosnia and HerzegovinaBotswanaBrazilBrunei DarussalamBulgariaBurkina FasoBurundiCabo VerdeCambodiaCameroonCanadaCaribbean small statesCentral African RepublicCentral Europe and the BalticsChadChileChinaColombiaComorosCongo, Dem. Rep.Congo, Rep.Costa RicaCote d'IvoireCroatiaCuracaoCyprusCzech RepublicDenmarkDjiboutiDominicaDominican RepublicEarly-demographic dividendEast Asia & PacificEast Asia & Pacific (excluding high income)East Asia & Pacific (IDA & IBRD countries)EcuadorEgypt, Arab Rep.El SalvadorEritreaEstoniaEthiopiaEuro areaEurope & Central AsiaEurope & Central Asia (excluding high income)Europe & Central Asia (IDA & IBRD countries)European UnionFaroe IslandsFijiFinlandFragile and conflict affected situationsFranceFrench PolynesiaGabonGambia, TheGeorgiaGermanyGhanaGreeceGrenadaGuatemalaGuineaGuinea-BissauGuyanaHaitiHeavily indebted poor countries (HIPC)High incomeHondurasHong Kong SAR, ChinaHungaryIBRD onlyIcelandIDA & IBRD totalIDA onlyIDA totalIndiaIndonesiaIran, Islamic Rep.IraqIrelandIsraelItalyJamaicaJapanJordanKazakhstanKenyaKiribatiKorea, Rep.KosovoKuwaitKyrgyz RepublicLao PDRLate-demographic dividendLatin America & Caribbean Latin America & Caribbean (excluding high income)Latin America & the Caribbean (IDA & IBRD countries)LatviaLeast developed countries: UN classificationLebanonLesothoLiberiaLibyaLithuaniaLow & middle incomeLow incomeLower middle incomeLuxembourgMacao SAR, ChinaMacedonia, FYRMadagascarMalawiMalaysiaMaldivesMaliMaltaMarshall IslandsMauritaniaMauritiusMexicoMicronesia, Fed. Sts.Middle East & North AfricaMiddle East & North Africa (excluding high income)Middle East & North Africa (IDA & IBRD countries)Middle incomeMoldovaMongoliaMontenegroMoroccoMozambiqueMyanmarNamibiaNepalNetherlandsNew CaledoniaNew ZealandNicaraguaNigerNigeriaNorth AmericaNorwayOECD membersOmanOther small statesPacific island small statesPakistanPalauPanamaPapua New GuineaParaguayPeruPhilippinesPolandPortugalPost-demographic dividendPre-demographic dividendQatarRomaniaRussian FederationRwandaSamoaSao Tome and PrincipeSaudi ArabiaSenegalSerbiaSeychellesSierra LeoneSingaporeSint Maarten (Dutch part)Slovak RepublicSloveniaSmall statesSolomon IslandsSouth AfricaSouth AsiaSouth Asia (IDA & IBRD)South SudanSpainSri LankaSt. Kitts and NevisSt. LuciaSt. Vincent and the GrenadinesSub-Saharan Africa Sub-Saharan Africa (excluding high income)Sub-Saharan Africa (IDA & IBRD countries)SudanSurinameSwazilandSwedenSwitzerlandSyrian Arab RepublicTajikistanTanzaniaThailandTimor-LesteTogoTongaTrinidad and TobagoTunisiaTurkeyTuvaluUgandaUkraineUnited KingdomUnited StatesUpper middle incomeUruguayVanuatuVenezuela, RBWest Bank and GazaWorldYemen, Rep.ZambiaZimbabwe Timeline:
This timeline shows a graph from 1971 to 2016 of United States. No data until 1970. Number of actual observations by date: 46.
Source name:
World Development Indicators
Source organization:
International Monetary Fund, Balance of Payments Statistics Yearbook and data files.
Categories, topics:
Economy & Growth, Trade
Last updated:
apr 23, 2017
Indicators value changes by year
Minimum:
20.585
jan 1, 2012
Maximum:
34.808
jan 1, 1985
At the date of observation
Value
Absolute change
Change from previous value
jan 1, 1971
27.167
+27.167
0.0%
jan 1, 1972
28.067
+0.9
3.31%
jan 1, 1973
29.56
+1.493
5.32%
jan 1, 1974
28.968
-0.592
-2.0%
jan 1, 1975
27.608
-1.36
-4.69%
jan 1, 1976
28.828
+1.22
4.42%
jan 1, 1977
27.539
-1.289
-4.47%
jan 1, 1978
27.0
-0.54
-1.96%
jan 1, 1979
26.728
-0.272
-1.01%
jan 1, 1980
26.001
-0.727
-2.72%
jan 1, 1981
25.409
-0.592
-2.28%
jan 1, 1982
26.248
+0.839
3.3%
jan 1, 1983
24.961
-1.287
-4.9%
jan 1, 1984
24.917
-0.044
-0.18%
jan 1, 1985
34.808
+9.891
39.7%
jan 1, 1986
34.555
-0.253
-0.73%
jan 1, 1987
32.941
-1.614
-4.67%
jan 1, 1988
32.848
-0.094
-0.28%
jan 1, 1989
33.176
+0.329
1.0%
jan 1, 1990
33.265
+0.089
0.27%
jan 1, 1991
32.379
-0.886
-2.66%
jan 1, 1992
30.498
-1.881
-5.81%
jan 1, 1993
33.146
+2.648
8.68%
jan 1, 1994
33.837
+0.691
2.09%
jan 1, 1995
33.872
+0.035
0.1%
jan 1, 1996
32.798
-1.075
-3.17%
jan 1, 1997
32.561
-0.236
-0.72%
jan 1, 1998
32.424
-0.138
-0.42%
jan 1, 1999
32.351
-0.072
-0.22%
jan 1, 2000
30.893
-1.458
-4.51%
jan 1, 2001
30.439
-0.454
-1.47%
jan 1, 2002
28.449
-1.99
-6.54%
jan 1, 2003
26.714
-1.735
-6.1%
jan 1, 2004
25.549
-1.165
-4.36%
jan 1, 2005
26.149
+0.6
2.35%
jan 1, 2006
26.274
+0.125
0.48%
jan 1, 2007
24.682
-1.592
-6.06%
jan 1, 2008
23.951
-0.731
-2.96%
jan 1, 2009
22.624
-1.327
-5.54%
jan 1, 2010
21.05
-1.575
-6.96%
jan 1, 2011
21.163
+0.113
0.54%
jan 1, 2012
20.585
-0.578
-2.73%
jan 1, 2013
22.198
+1.613
7.84%
jan 1, 2014
21.28
-0.918
-4.13%
jan 1, 2015
21.927
+0.647
3.04%
jan 1, 2016
23.099
+1.171
5.34%
Ranking of countries by current statistics by years


Comments: