29
/
en
AIzaSyAYiBZKx7MnpbEhh9jyipgxe19OcubqV5w
April 1, 2024
149846
Haiti
HTI
true
2
1
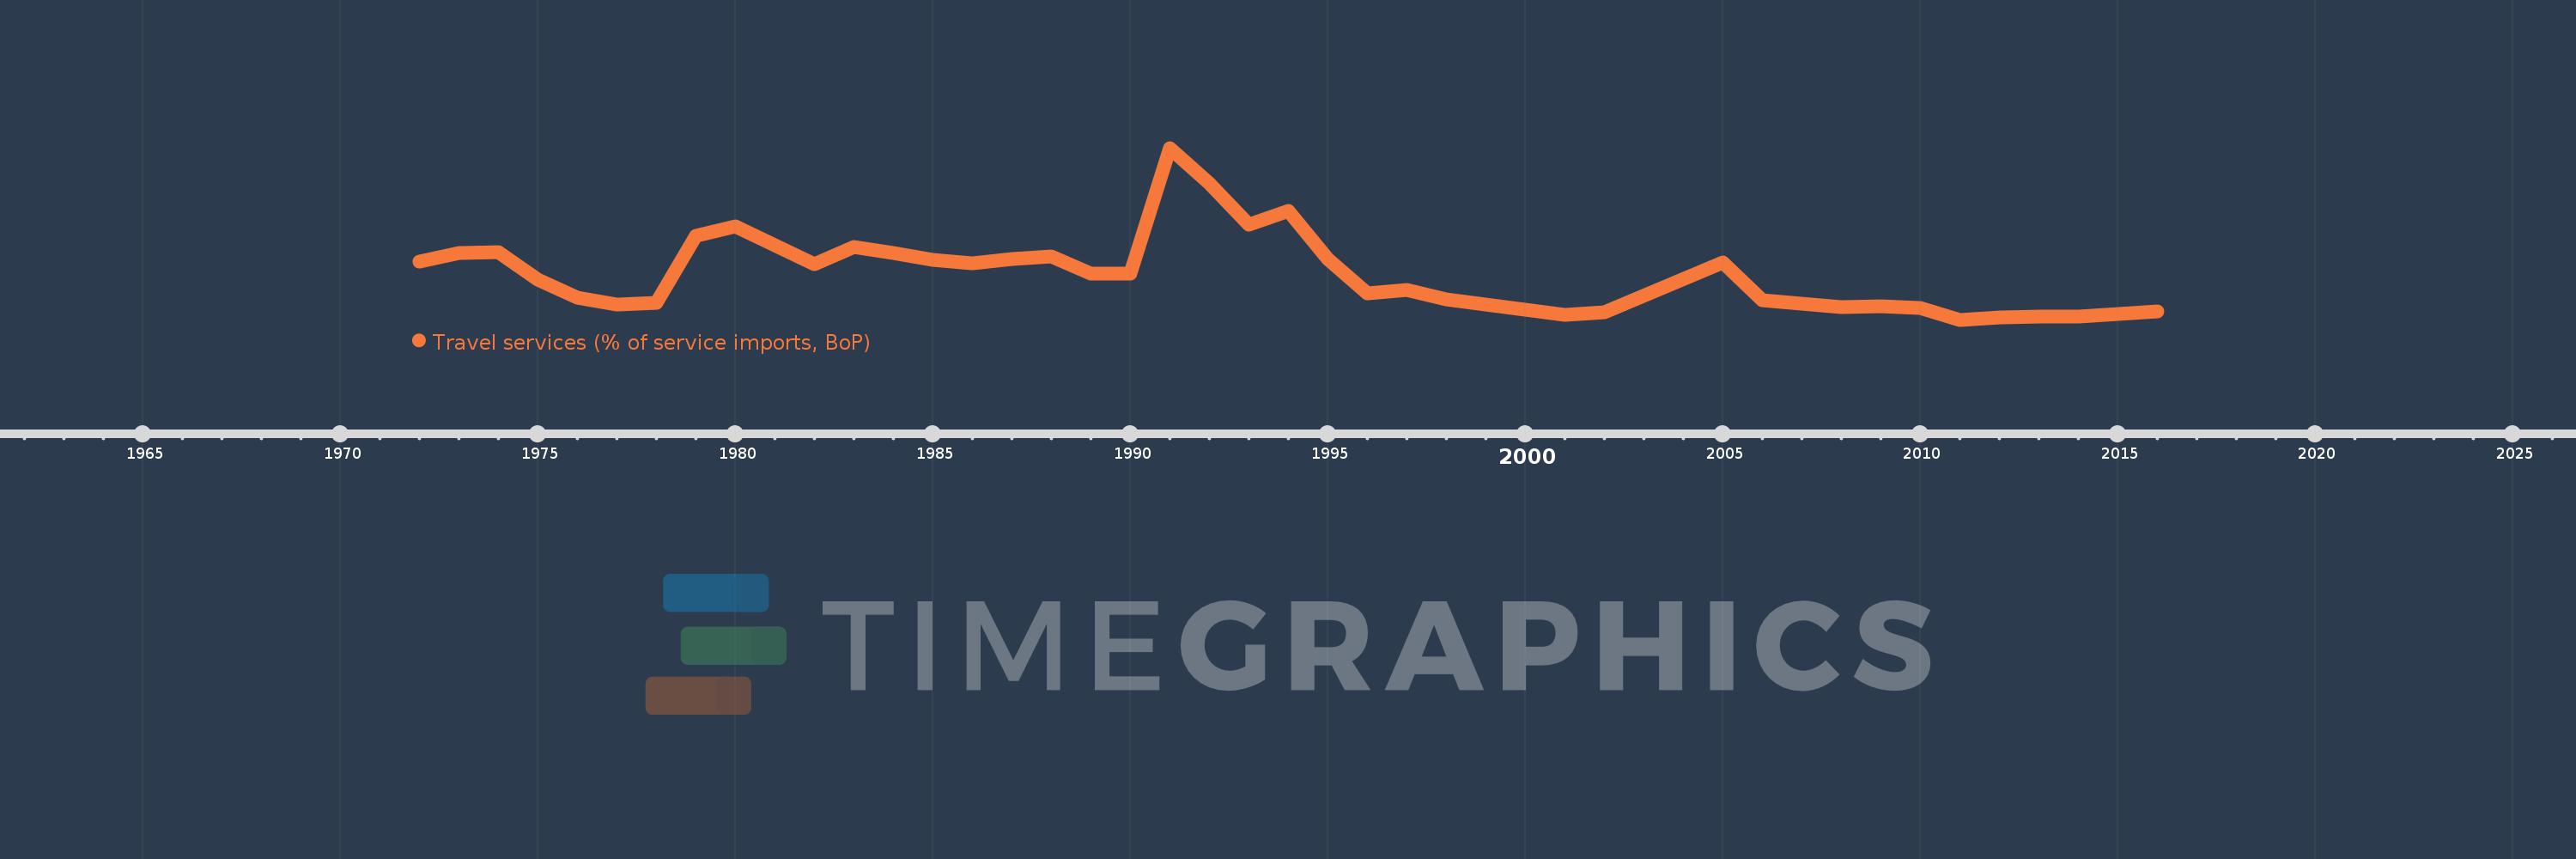
Travel services (% of service imports, BoP)
2016,2015,2014,2013,2012,2011,2010,2009,2008,2007,2006,2005,2002,2001,1998,1997,1996,1995,1994,1993,1992,1991,1990,1989,1988,1987,1986,1985,1984,1983,1982,1981,1980,1979,1978,1977,1976,1975,1974,1973,1972
This statistics in other country:
AfghanistanAlbaniaAlgeriaAngolaAntigua and BarbudaArab WorldArgentinaArmeniaArubaAustraliaAustriaAzerbaijanBahamas, TheBahrainBangladeshBarbadosBelarusBelgiumBelizeBeninBermudaBhutanBoliviaBosnia and HerzegovinaBotswanaBrazilBrunei DarussalamBulgariaBurkina FasoBurundiCabo VerdeCambodiaCameroonCanadaCaribbean small statesCentral African RepublicCentral Europe and the BalticsChadChileChinaColombiaComorosCongo, Dem. Rep.Congo, Rep.Costa RicaCote d'IvoireCroatiaCuracaoCyprusCzech RepublicDenmarkDjiboutiDominicaDominican RepublicEarly-demographic dividendEast Asia & PacificEast Asia & Pacific (excluding high income)East Asia & Pacific (IDA & IBRD countries)EcuadorEgypt, Arab Rep.El SalvadorEritreaEstoniaEthiopiaEuro areaEurope & Central AsiaEurope & Central Asia (excluding high income)Europe & Central Asia (IDA & IBRD countries)European UnionFaroe IslandsFijiFinlandFragile and conflict affected situationsFranceFrench PolynesiaGabonGambia, TheGeorgiaGermanyGhanaGreeceGrenadaGuatemalaGuineaGuinea-BissauGuyanaHaitiHeavily indebted poor countries (HIPC)High incomeHondurasHong Kong SAR, ChinaHungaryIBRD onlyIcelandIDA & IBRD totalIDA onlyIDA totalIndiaIndonesiaIran, Islamic Rep.IraqIrelandIsraelItalyJamaicaJapanJordanKazakhstanKenyaKiribatiKorea, Rep.KosovoKuwaitKyrgyz RepublicLao PDRLate-demographic dividendLatin America & Caribbean Latin America & Caribbean (excluding high income)Latin America & the Caribbean (IDA & IBRD countries)LatviaLeast developed countries: UN classificationLebanonLesothoLiberiaLibyaLithuaniaLow & middle incomeLow incomeLower middle incomeLuxembourgMacao SAR, ChinaMacedonia, FYRMadagascarMalawiMalaysiaMaldivesMaliMaltaMarshall IslandsMauritaniaMauritiusMexicoMicronesia, Fed. Sts.Middle East & North AfricaMiddle East & North Africa (excluding high income)Middle East & North Africa (IDA & IBRD countries)Middle incomeMoldovaMongoliaMontenegroMoroccoMozambiqueMyanmarNamibiaNepalNetherlandsNew CaledoniaNew ZealandNicaraguaNigerNigeriaNorth AmericaNorwayOECD membersOmanOther small statesPacific island small statesPakistanPalauPanamaPapua New GuineaParaguayPeruPhilippinesPolandPortugalPost-demographic dividendPre-demographic dividendQatarRomaniaRussian FederationRwandaSamoaSao Tome and PrincipeSaudi ArabiaSenegalSerbiaSeychellesSierra LeoneSingaporeSint Maarten (Dutch part)Slovak RepublicSloveniaSmall statesSolomon IslandsSouth AfricaSouth AsiaSouth Asia (IDA & IBRD)South SudanSpainSri LankaSt. Kitts and NevisSt. LuciaSt. Vincent and the GrenadinesSub-Saharan Africa Sub-Saharan Africa (excluding high income)Sub-Saharan Africa (IDA & IBRD countries)SudanSurinameSwazilandSwedenSwitzerlandSyrian Arab RepublicTajikistanTanzaniaThailandTimor-LesteTogoTongaTrinidad and TobagoTunisiaTurkeyTuvaluUgandaUkraineUnited KingdomUnited StatesUpper middle incomeUruguayVanuatuVenezuela, RBWest Bank and GazaWorldYemen, Rep.ZambiaZimbabwe Timeline:
This timeline shows a graph from 1972 to 2016 of Haiti. No data until 1971. Number of actual observations by date: 41.
Source name:
World Development Indicators
Source organization:
International Monetary Fund, Balance of Payments Statistics Yearbook and data files.
Categories, topics:
Economy & Growth, Trade
Last updated:
apr 23, 2017
Indicators value changes by year
Maximum:
51.389
jan 1, 1991
At the date of observation
Value
Absolute change
Change from previous value
jan 1, 1972
20.699
+20.699
0.0%
jan 1, 1973
23.022
+2.322
11.22%
jan 1, 1974
23.256
+0.234
1.02%
jan 1, 1975
15.867
-7.389
-31.77%
jan 1, 1976
10.986
-4.88
-30.76%
jan 1, 1977
9.019
-1.967
-17.91%
jan 1, 1978
9.474
+0.455
5.05%
jan 1, 1979
27.691
+18.217
192.29%
jan 1, 1980
30.163
+2.472
8.93%
jan 1, 1981
25.056
-5.108
-16.93%
jan 1, 1982
19.877
-5.178
-20.67%
jan 1, 1983
24.666
+4.789
24.09%
jan 1, 1984
22.986
-1.68
-6.81%
jan 1, 1985
21.153
-1.833
-7.98%
jan 1, 1986
20.2
-0.953
-4.51%
jan 1, 1987
21.44
+1.241
6.14%
jan 1, 1988
22.034
+0.594
2.77%
jan 1, 1989
17.461
-4.573
-20.75%
jan 1, 1990
17.348
-0.113
-0.65%
jan 1, 1991
51.389
+34.041
196.22%
jan 1, 1992
41.897
-9.492
-18.47%
jan 1, 1993
30.682
-11.215
-26.77%
jan 1, 1994
34.437
+3.755
12.24%
jan 1, 1995
21.44
-12.997
-37.74%
jan 1, 1996
12.196
-9.243
-43.11%
jan 1, 1997
13.062
+0.865
7.1%
jan 1, 1998
10.498
-2.564
-19.63%
jan 1, 2001
6.383
-4.115
-39.2%
jan 1, 2002
6.911
+0.528
8.27%
jan 1, 2005
20.458
+13.547
196.02%
jan 1, 2006
10.171
-10.287
-50.28%
jan 1, 2007
9.377
-0.794
-7.81%
jan 1, 2008
8.301
-1.076
-11.47%
jan 1, 2009
8.546
+0.244
2.94%
jan 1, 2010
8.113
-0.433
-5.07%
jan 1, 2011
4.955
-3.157
-38.92%
jan 1, 2012
5.512
+0.556
11.23%
jan 1, 2013
5.716
+0.204
3.7%
jan 1, 2014
5.716
0.0
0.0%
jan 1, 2015
6.448
+0.732
12.8%
jan 1, 2016
7.133
+0.686
10.64%
Ranking of countries by current statistics by years


Comments: