29
/
en
AIzaSyAYiBZKx7MnpbEhh9jyipgxe19OcubqV5w
April 1, 2024
70633
Argentina
ARG
true
2
1
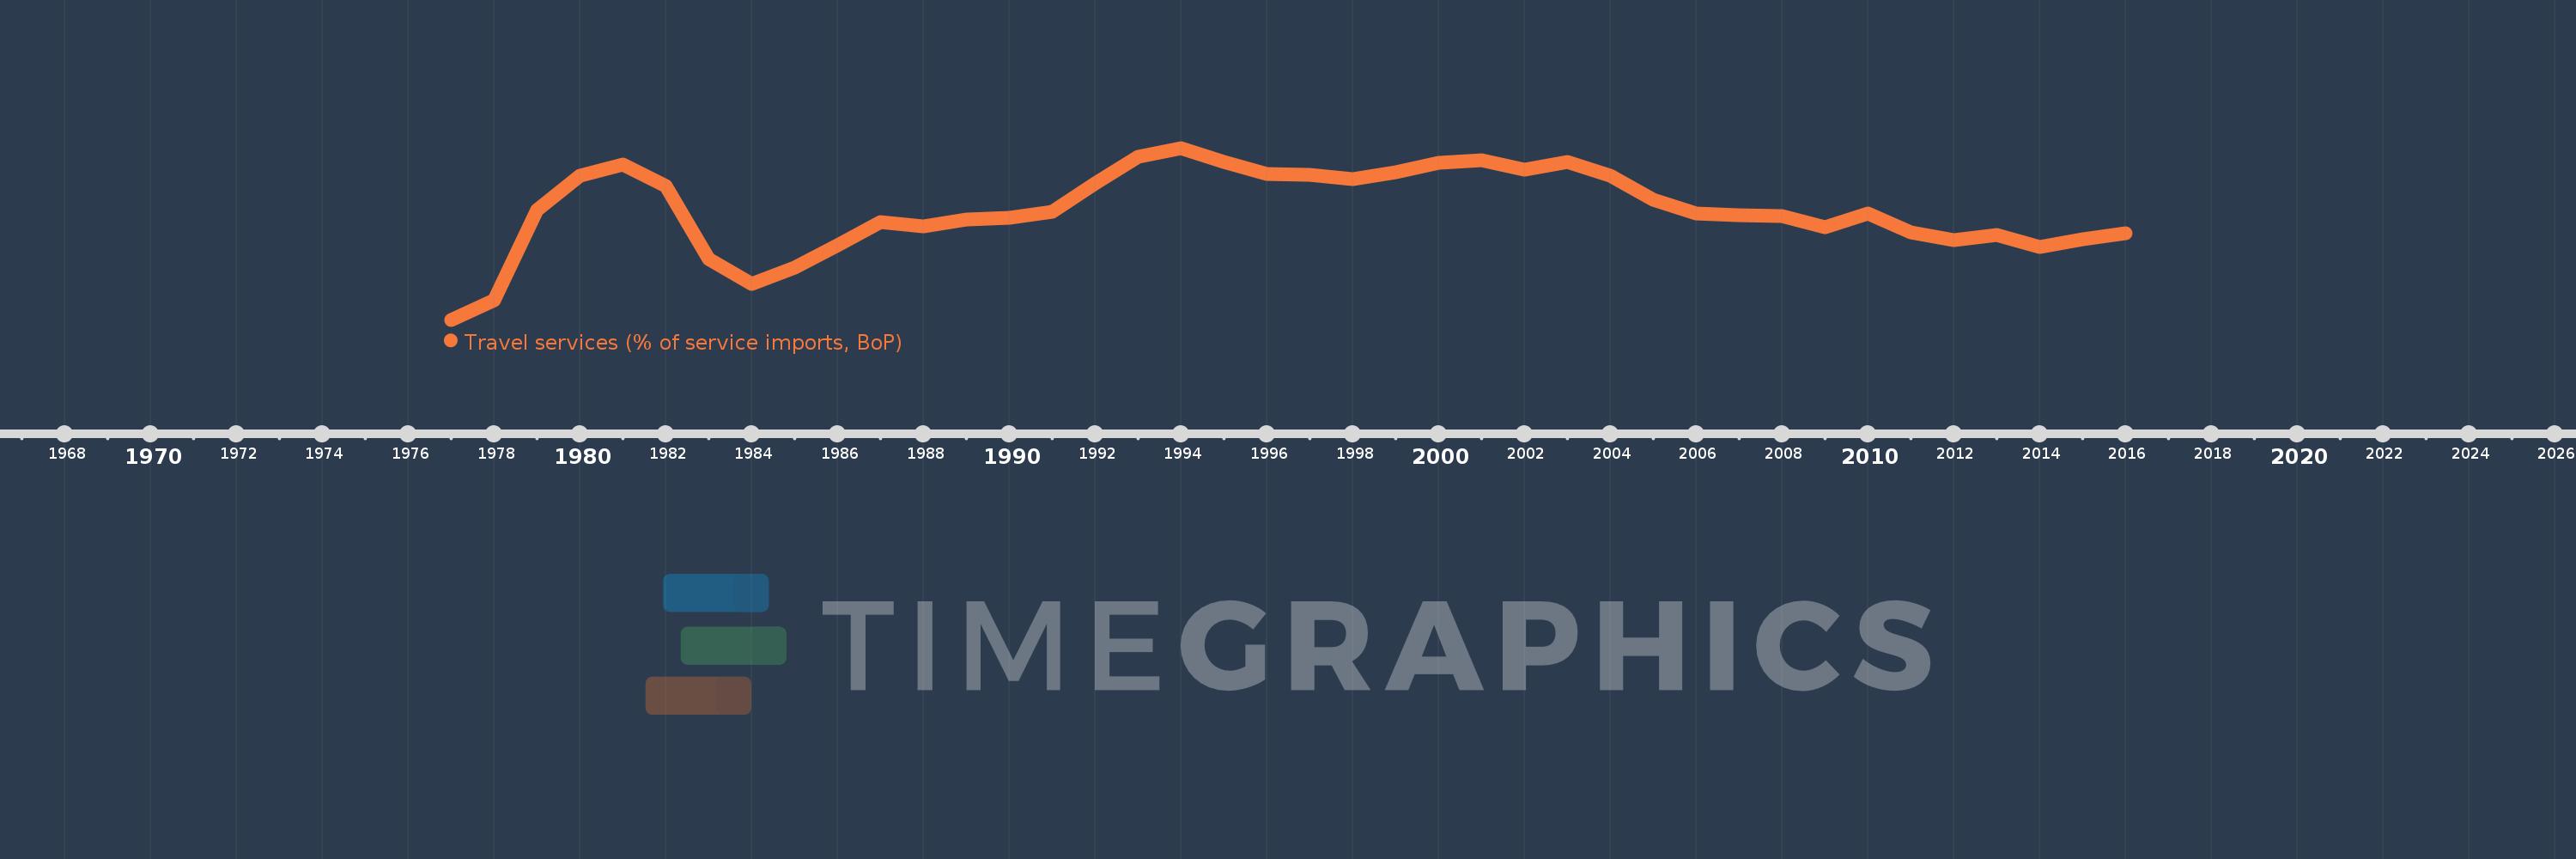
Travel services (% of service imports, BoP)
2016,2015,2014,2013,2012,2011,2010,2009,2008,2007,2006,2005,2004,2003,2002,2001,2000,1999,1998,1997,1996,1995,1994,1993,1992,1991,1990,1989,1988,1987,1986,1985,1984,1983,1982,1981,1980,1979,1978,1977
This statistics in other country:
AfghanistanAlbaniaAlgeriaAngolaAntigua and BarbudaArab WorldArgentinaArmeniaArubaAustraliaAustriaAzerbaijanBahamas, TheBahrainBangladeshBarbadosBelarusBelgiumBelizeBeninBermudaBhutanBoliviaBosnia and HerzegovinaBotswanaBrazilBrunei DarussalamBulgariaBurkina FasoBurundiCabo VerdeCambodiaCameroonCanadaCaribbean small statesCentral African RepublicCentral Europe and the BalticsChadChileChinaColombiaComorosCongo, Dem. Rep.Congo, Rep.Costa RicaCote d'IvoireCroatiaCuracaoCyprusCzech RepublicDenmarkDjiboutiDominicaDominican RepublicEarly-demographic dividendEast Asia & PacificEast Asia & Pacific (excluding high income)East Asia & Pacific (IDA & IBRD countries)EcuadorEgypt, Arab Rep.El SalvadorEritreaEstoniaEthiopiaEuro areaEurope & Central AsiaEurope & Central Asia (excluding high income)Europe & Central Asia (IDA & IBRD countries)European UnionFaroe IslandsFijiFinlandFragile and conflict affected situationsFranceFrench PolynesiaGabonGambia, TheGeorgiaGermanyGhanaGreeceGrenadaGuatemalaGuineaGuinea-BissauGuyanaHaitiHeavily indebted poor countries (HIPC)High incomeHondurasHong Kong SAR, ChinaHungaryIBRD onlyIcelandIDA & IBRD totalIDA onlyIDA totalIndiaIndonesiaIran, Islamic Rep.IraqIrelandIsraelItalyJamaicaJapanJordanKazakhstanKenyaKiribatiKorea, Rep.KosovoKuwaitKyrgyz RepublicLao PDRLate-demographic dividendLatin America & Caribbean Latin America & Caribbean (excluding high income)Latin America & the Caribbean (IDA & IBRD countries)LatviaLeast developed countries: UN classificationLebanonLesothoLiberiaLibyaLithuaniaLow & middle incomeLow incomeLower middle incomeLuxembourgMacao SAR, ChinaMacedonia, FYRMadagascarMalawiMalaysiaMaldivesMaliMaltaMarshall IslandsMauritaniaMauritiusMexicoMicronesia, Fed. Sts.Middle East & North AfricaMiddle East & North Africa (excluding high income)Middle East & North Africa (IDA & IBRD countries)Middle incomeMoldovaMongoliaMontenegroMoroccoMozambiqueMyanmarNamibiaNepalNetherlandsNew CaledoniaNew ZealandNicaraguaNigerNigeriaNorth AmericaNorwayOECD membersOmanOther small statesPacific island small statesPakistanPalauPanamaPapua New GuineaParaguayPeruPhilippinesPolandPortugalPost-demographic dividendPre-demographic dividendQatarRomaniaRussian FederationRwandaSamoaSao Tome and PrincipeSaudi ArabiaSenegalSerbiaSeychellesSierra LeoneSingaporeSint Maarten (Dutch part)Slovak RepublicSloveniaSmall statesSolomon IslandsSouth AfricaSouth AsiaSouth Asia (IDA & IBRD)South SudanSpainSri LankaSt. Kitts and NevisSt. LuciaSt. Vincent and the GrenadinesSub-Saharan Africa Sub-Saharan Africa (excluding high income)Sub-Saharan Africa (IDA & IBRD countries)SudanSurinameSwazilandSwedenSwitzerlandSyrian Arab RepublicTajikistanTanzaniaThailandTimor-LesteTogoTongaTrinidad and TobagoTunisiaTurkeyTuvaluUgandaUkraineUnited KingdomUnited StatesUpper middle incomeUruguayVanuatuVenezuela, RBWest Bank and GazaWorldYemen, Rep.ZambiaZimbabwe Timeline:
This timeline shows a graph from 1977 to 2016 of Argentina. No data until 1976. Number of actual observations by date: 40.
Source name:
World Development Indicators
Source organization:
International Monetary Fund, Balance of Payments Statistics Yearbook and data files.
Categories, topics:
Economy & Growth, Trade
Last updated:
apr 23, 2017
Indicators value changes by year
Minimum:
15.499
jan 1, 1977
Maximum:
50.661
jan 1, 1994
At the date of observation
Value
Absolute change
Change from previous value
jan 1, 1977
15.499
+15.499
0.0%
jan 1, 1978
19.442
+3.943
25.44%
jan 1, 1979
38.018
+18.577
95.55%
jan 1, 1980
44.954
+6.936
18.24%
jan 1, 1981
47.307
+2.353
5.24%
jan 1, 1982
42.836
-4.471
-9.45%
jan 1, 1983
27.998
-14.838
-34.64%
jan 1, 1984
22.797
-5.201
-18.58%
jan 1, 1985
26.212
+3.416
14.98%
jan 1, 1986
30.681
+4.469
17.05%
jan 1, 1987
35.52
+4.839
15.77%
jan 1, 1988
34.684
-0.836
-2.35%
jan 1, 1989
36.084
+1.4
4.04%
jan 1, 1990
36.305
+0.221
0.61%
jan 1, 1991
37.532
+1.227
3.38%
jan 1, 1992
43.399
+5.867
15.63%
jan 1, 1993
48.888
+5.489
12.65%
jan 1, 1994
50.661
+1.774
3.63%
jan 1, 1995
47.784
-2.878
-5.68%
jan 1, 1996
45.332
-2.451
-5.13%
jan 1, 1997
45.2
-0.133
-0.29%
jan 1, 1998
44.233
-0.967
-2.14%
jan 1, 1999
45.65
+1.417
3.2%
jan 1, 2000
47.668
+2.018
4.42%
jan 1, 2001
48.204
+0.536
1.13%
jan 1, 2002
46.141
-2.063
-4.28%
jan 1, 2003
47.852
+1.711
3.71%
jan 1, 2004
44.921
-2.931
-6.13%
jan 1, 2005
39.985
-4.935
-10.99%
jan 1, 2006
37.211
-2.774
-6.94%
jan 1, 2007
36.957
-0.255
-0.68%
jan 1, 2008
36.636
-0.321
-0.87%
jan 1, 2009
34.41
-2.226
-6.08%
jan 1, 2010
37.196
+2.786
8.1%
jan 1, 2011
33.378
-3.818
-10.26%
jan 1, 2012
31.726
-1.652
-4.95%
jan 1, 2013
32.821
+1.095
3.45%
jan 1, 2014
30.461
-2.359
-7.19%
jan 1, 2015
31.913
+1.452
4.77%
jan 1, 2016
33.181
+1.268
3.97%
Ranking of countries by current statistics by years


Comments: