29
/
en
AIzaSyAYiBZKx7MnpbEhh9jyipgxe19OcubqV5w
April 1, 2024
26988
Early-demographic dividend
EAR
false
2
1
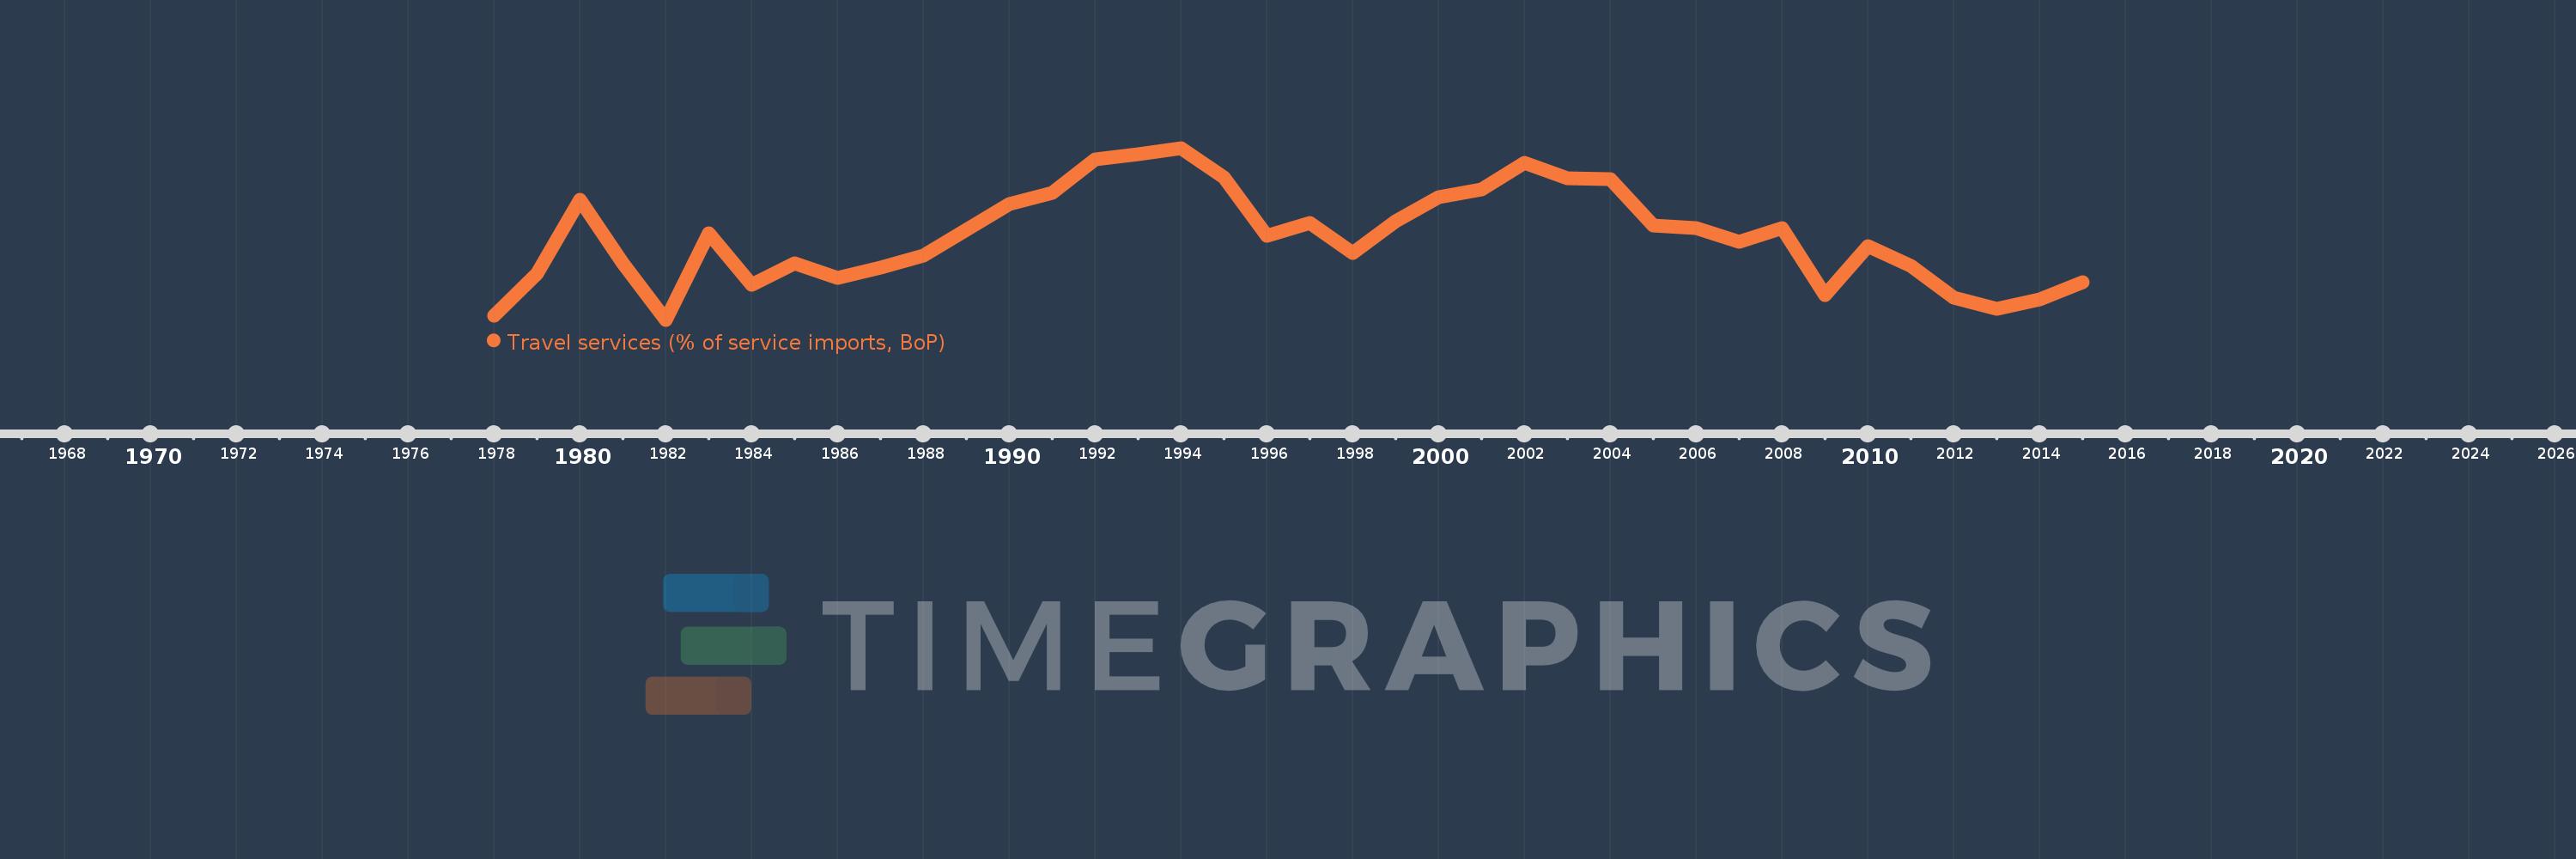
Travel services (% of service imports, BoP)
2015,2014,2013,2012,2011,2010,2009,2008,2007,2006,2005,2004,2003,2002,2001,2000,1999,1998,1997,1996,1995,1994,1993,1992,1991,1990,1989,1988,1987,1986,1985,1984,1983,1982,1981,1980,1979,1978
This statistics in other country:
AfghanistanAlbaniaAlgeriaAngolaAntigua and BarbudaArab WorldArgentinaArmeniaArubaAustraliaAustriaAzerbaijanBahamas, TheBahrainBangladeshBarbadosBelarusBelgiumBelizeBeninBermudaBhutanBoliviaBosnia and HerzegovinaBotswanaBrazilBrunei DarussalamBulgariaBurkina FasoBurundiCabo VerdeCambodiaCameroonCanadaCaribbean small statesCentral African RepublicCentral Europe and the BalticsChadChileChinaColombiaComorosCongo, Dem. Rep.Congo, Rep.Costa RicaCote d'IvoireCroatiaCuracaoCyprusCzech RepublicDenmarkDjiboutiDominicaDominican RepublicEarly-demographic dividendEast Asia & PacificEast Asia & Pacific (excluding high income)East Asia & Pacific (IDA & IBRD countries)EcuadorEgypt, Arab Rep.El SalvadorEritreaEstoniaEthiopiaEuro areaEurope & Central AsiaEurope & Central Asia (excluding high income)Europe & Central Asia (IDA & IBRD countries)European UnionFaroe IslandsFijiFinlandFragile and conflict affected situationsFranceFrench PolynesiaGabonGambia, TheGeorgiaGermanyGhanaGreeceGrenadaGuatemalaGuineaGuinea-BissauGuyanaHaitiHeavily indebted poor countries (HIPC)High incomeHondurasHong Kong SAR, ChinaHungaryIBRD onlyIcelandIDA & IBRD totalIDA onlyIDA totalIndiaIndonesiaIran, Islamic Rep.IraqIrelandIsraelItalyJamaicaJapanJordanKazakhstanKenyaKiribatiKorea, Rep.KosovoKuwaitKyrgyz RepublicLao PDRLate-demographic dividendLatin America & Caribbean Latin America & Caribbean (excluding high income)Latin America & the Caribbean (IDA & IBRD countries)LatviaLeast developed countries: UN classificationLebanonLesothoLiberiaLibyaLithuaniaLow & middle incomeLow incomeLower middle incomeLuxembourgMacao SAR, ChinaMacedonia, FYRMadagascarMalawiMalaysiaMaldivesMaliMaltaMarshall IslandsMauritaniaMauritiusMexicoMicronesia, Fed. Sts.Middle East & North AfricaMiddle East & North Africa (excluding high income)Middle East & North Africa (IDA & IBRD countries)Middle incomeMoldovaMongoliaMontenegroMoroccoMozambiqueMyanmarNamibiaNepalNetherlandsNew CaledoniaNew ZealandNicaraguaNigerNigeriaNorth AmericaNorwayOECD membersOmanOther small statesPacific island small statesPakistanPalauPanamaPapua New GuineaParaguayPeruPhilippinesPolandPortugalPost-demographic dividendPre-demographic dividendQatarRomaniaRussian FederationRwandaSamoaSao Tome and PrincipeSaudi ArabiaSenegalSerbiaSeychellesSierra LeoneSingaporeSint Maarten (Dutch part)Slovak RepublicSloveniaSmall statesSolomon IslandsSouth AfricaSouth AsiaSouth Asia (IDA & IBRD)South SudanSpainSri LankaSt. Kitts and NevisSt. LuciaSt. Vincent and the GrenadinesSub-Saharan Africa Sub-Saharan Africa (excluding high income)Sub-Saharan Africa (IDA & IBRD countries)SudanSurinameSwazilandSwedenSwitzerlandSyrian Arab RepublicTajikistanTanzaniaThailandTimor-LesteTogoTongaTrinidad and TobagoTunisiaTurkeyTuvaluUgandaUkraineUnited KingdomUnited StatesUpper middle incomeUruguayVanuatuVenezuela, RBWest Bank and GazaWorldYemen, Rep.ZambiaZimbabwe Timeline:
This timeline shows a graph from 1978 to 2015 of Early-demographic dividend. No data until 1977. Number of actual observations by date: 38.
Source name:
World Development Indicators
Source organization:
International Monetary Fund, Balance of Payments Statistics Yearbook and data files.
Categories, topics:
Economy & Growth, Trade
Last updated:
apr 23, 2017
Indicators value changes by year
Minimum:
17.847
jan 1, 1982
Maximum:
26.191
jan 1, 1994
At the date of observation
Value
Absolute change
Change from previous value
jan 1, 1978
18.052
+18.052
0.0%
jan 1, 1979
20.09
+2.038
11.29%
jan 1, 1980
23.674
+3.584
17.84%
jan 1, 1981
20.599
-3.075
-12.99%
jan 1, 1982
17.847
-2.752
-13.36%
jan 1, 1983
22.054
+4.207
23.57%
jan 1, 1984
19.537
-2.517
-11.41%
jan 1, 1985
20.584
+1.047
5.36%
jan 1, 1986
19.894
-0.69
-3.35%
jan 1, 1987
20.359
+0.465
2.34%
jan 1, 1988
20.967
+0.607
2.98%
jan 1, 1989
22.213
+1.246
5.94%
jan 1, 1990
23.461
+1.248
5.62%
jan 1, 1991
23.993
+0.531
2.26%
jan 1, 1992
25.647
+1.654
6.89%
jan 1, 1993
25.907
+0.26
1.02%
jan 1, 1994
26.191
+0.284
1.1%
jan 1, 1995
24.74
-1.452
-5.54%
jan 1, 1996
21.94
-2.799
-11.31%
jan 1, 1997
22.54
+0.6
2.73%
jan 1, 1998
21.103
-1.438
-6.38%
jan 1, 1999
22.637
+1.535
7.27%
jan 1, 2000
23.785
+1.148
5.07%
jan 1, 2001
24.179
+0.394
1.66%
jan 1, 2002
25.489
+1.31
5.42%
jan 1, 2003
24.698
-0.791
-3.1%
jan 1, 2004
24.673
-0.025
-0.1%
jan 1, 2005
22.443
-2.23
-9.04%
jan 1, 2006
22.313
-0.13
-0.58%
jan 1, 2007
21.617
-0.696
-3.12%
jan 1, 2008
22.316
+0.699
3.23%
jan 1, 2009
19.048
-3.268
-14.64%
jan 1, 2010
21.404
+2.355
12.37%
jan 1, 2011
20.46
-0.944
-4.41%
jan 1, 2012
18.934
-1.525
-7.46%
jan 1, 2013
18.384
-0.551
-2.91%
jan 1, 2014
18.842
+0.458
2.49%
jan 1, 2015
19.659
+0.818
4.34%
Ranking of countries by current statistics by years


Comments: