29
/
en
AIzaSyAYiBZKx7MnpbEhh9jyipgxe19OcubqV5w
April 1, 2024
119496
Denmark
DNK
true
2
1
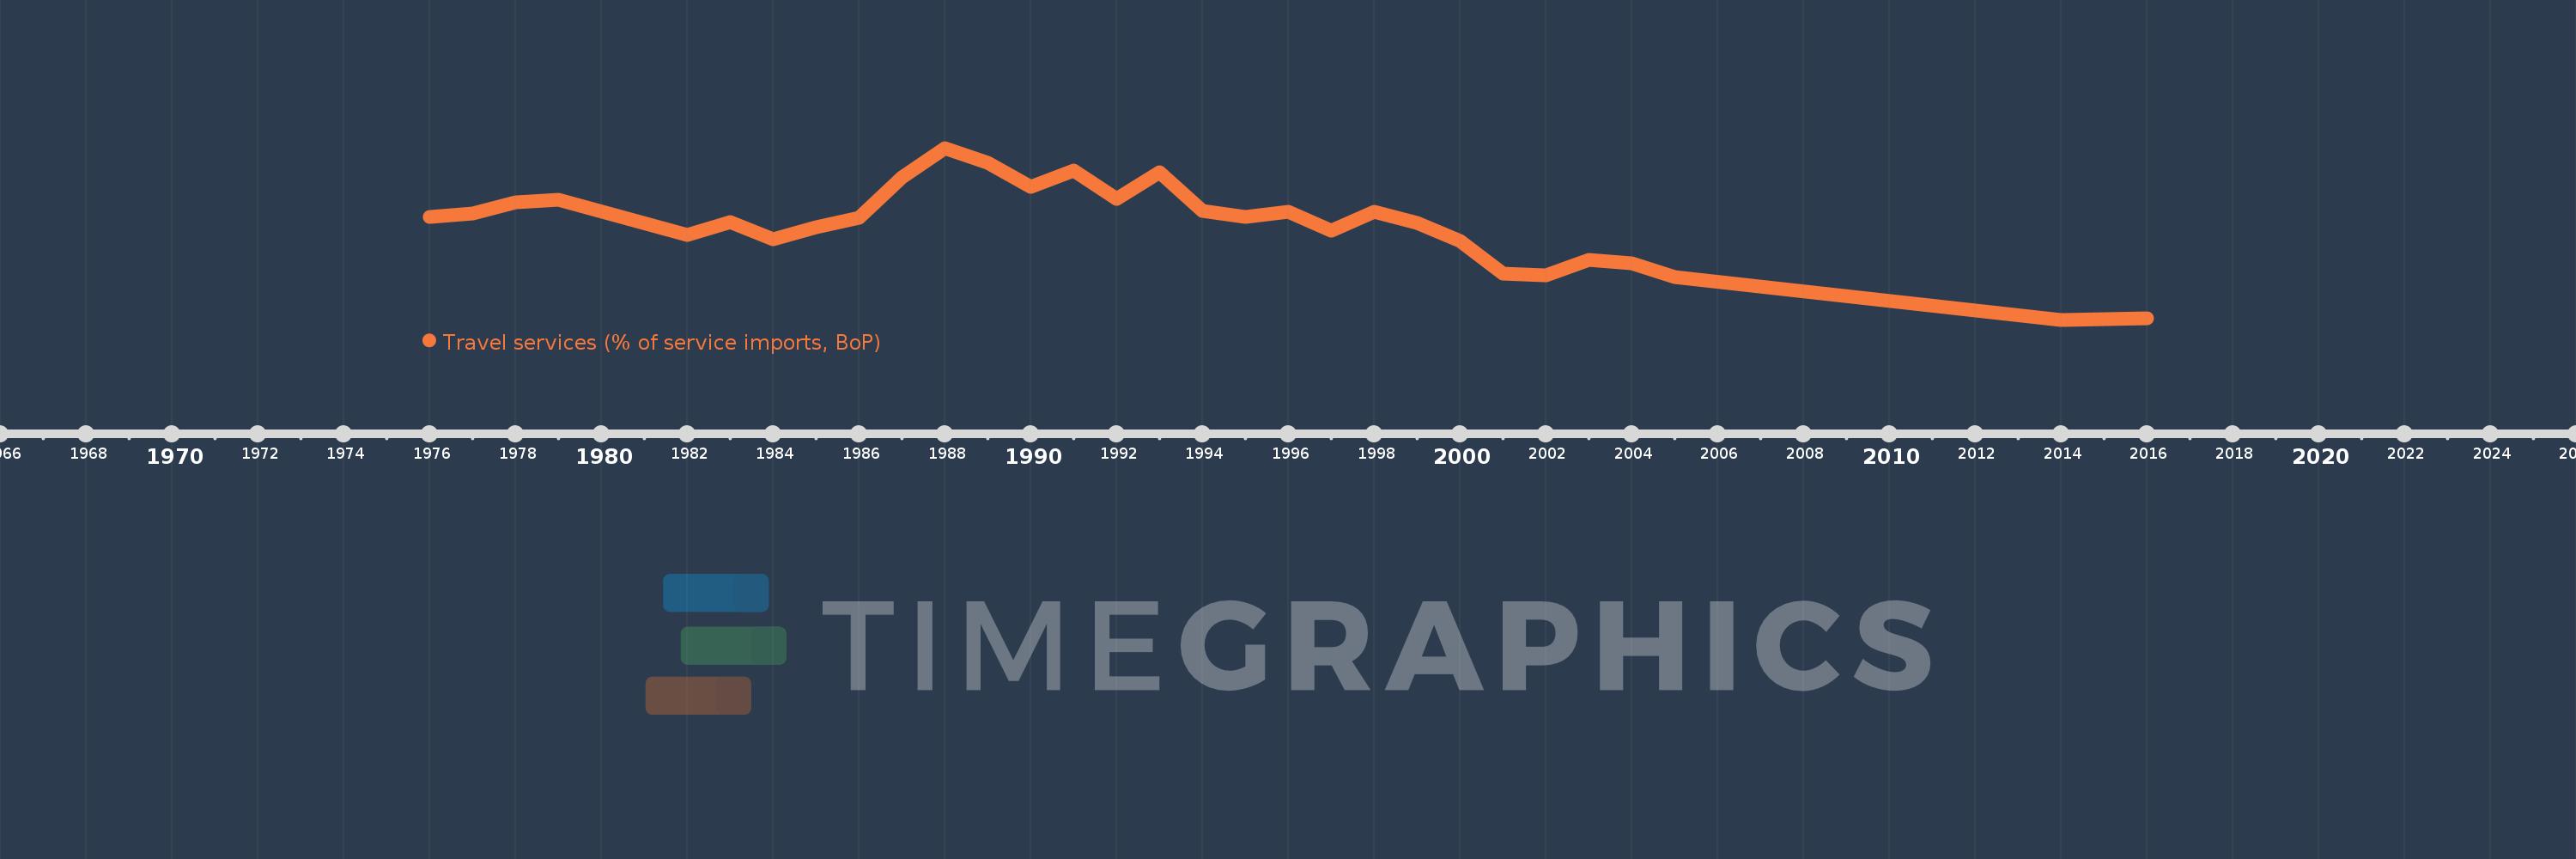
Travel services (% of service imports, BoP)
2016,2015,2014,2005,2004,2003,2002,2001,2000,1999,1998,1997,1996,1995,1994,1993,1992,1991,1990,1989,1988,1987,1986,1985,1984,1983,1982,1979,1978,1977,1976
This statistics in other country:
AfghanistanAlbaniaAlgeriaAngolaAntigua and BarbudaArab WorldArgentinaArmeniaArubaAustraliaAustriaAzerbaijanBahamas, TheBahrainBangladeshBarbadosBelarusBelgiumBelizeBeninBermudaBhutanBoliviaBosnia and HerzegovinaBotswanaBrazilBrunei DarussalamBulgariaBurkina FasoBurundiCabo VerdeCambodiaCameroonCanadaCaribbean small statesCentral African RepublicCentral Europe and the BalticsChadChileChinaColombiaComorosCongo, Dem. Rep.Congo, Rep.Costa RicaCote d'IvoireCroatiaCuracaoCyprusCzech RepublicDenmarkDjiboutiDominicaDominican RepublicEarly-demographic dividendEast Asia & PacificEast Asia & Pacific (excluding high income)East Asia & Pacific (IDA & IBRD countries)EcuadorEgypt, Arab Rep.El SalvadorEritreaEstoniaEthiopiaEuro areaEurope & Central AsiaEurope & Central Asia (excluding high income)Europe & Central Asia (IDA & IBRD countries)European UnionFaroe IslandsFijiFinlandFragile and conflict affected situationsFranceFrench PolynesiaGabonGambia, TheGeorgiaGermanyGhanaGreeceGrenadaGuatemalaGuineaGuinea-BissauGuyanaHaitiHeavily indebted poor countries (HIPC)High incomeHondurasHong Kong SAR, ChinaHungaryIBRD onlyIcelandIDA & IBRD totalIDA onlyIDA totalIndiaIndonesiaIran, Islamic Rep.IraqIrelandIsraelItalyJamaicaJapanJordanKazakhstanKenyaKiribatiKorea, Rep.KosovoKuwaitKyrgyz RepublicLao PDRLate-demographic dividendLatin America & Caribbean Latin America & Caribbean (excluding high income)Latin America & the Caribbean (IDA & IBRD countries)LatviaLeast developed countries: UN classificationLebanonLesothoLiberiaLibyaLithuaniaLow & middle incomeLow incomeLower middle incomeLuxembourgMacao SAR, ChinaMacedonia, FYRMadagascarMalawiMalaysiaMaldivesMaliMaltaMarshall IslandsMauritaniaMauritiusMexicoMicronesia, Fed. Sts.Middle East & North AfricaMiddle East & North Africa (excluding high income)Middle East & North Africa (IDA & IBRD countries)Middle incomeMoldovaMongoliaMontenegroMoroccoMozambiqueMyanmarNamibiaNepalNetherlandsNew CaledoniaNew ZealandNicaraguaNigerNigeriaNorth AmericaNorwayOECD membersOmanOther small statesPacific island small statesPakistanPalauPanamaPapua New GuineaParaguayPeruPhilippinesPolandPortugalPost-demographic dividendPre-demographic dividendQatarRomaniaRussian FederationRwandaSamoaSao Tome and PrincipeSaudi ArabiaSenegalSerbiaSeychellesSierra LeoneSingaporeSint Maarten (Dutch part)Slovak RepublicSloveniaSmall statesSolomon IslandsSouth AfricaSouth AsiaSouth Asia (IDA & IBRD)South SudanSpainSri LankaSt. Kitts and NevisSt. LuciaSt. Vincent and the GrenadinesSub-Saharan Africa Sub-Saharan Africa (excluding high income)Sub-Saharan Africa (IDA & IBRD countries)SudanSurinameSwazilandSwedenSwitzerlandSyrian Arab RepublicTajikistanTanzaniaThailandTimor-LesteTogoTongaTrinidad and TobagoTunisiaTurkeyTuvaluUgandaUkraineUnited KingdomUnited StatesUpper middle incomeUruguayVanuatuVenezuela, RBWest Bank and GazaWorldYemen, Rep.ZambiaZimbabwe Timeline:
This timeline shows a graph from 1976 to 2016 of Denmark. No data until 1975. Number of actual observations by date: 31.
Source name:
World Development Indicators
Source organization:
International Monetary Fund, Balance of Payments Statistics Yearbook and data files.
Categories, topics:
Economy & Growth, Trade
Last updated:
apr 23, 2017
Indicators value changes by year
Minimum:
16.004
jan 1, 2014
Maximum:
39.136
jan 1, 1988
At the date of observation
Value
Absolute change
Change from previous value
jan 1, 1976
29.84
+29.84
0.0%
jan 1, 1977
30.254
+0.414
1.39%
jan 1, 1978
31.827
+1.573
5.2%
jan 1, 1979
32.111
+0.284
0.89%
jan 1, 1982
27.367
-4.744
-14.78%
jan 1, 1983
29.196
+1.83
6.69%
jan 1, 1984
26.804
-2.392
-8.19%
jan 1, 1985
28.461
+1.656
6.18%
jan 1, 1986
29.758
+1.298
4.56%
jan 1, 1987
35.154
+5.396
18.13%
jan 1, 1988
39.136
+3.982
11.33%
jan 1, 1989
37.126
-2.011
-5.14%
jan 1, 1990
33.924
-3.201
-8.62%
jan 1, 1991
36.124
+2.2
6.49%
jan 1, 1992
32.334
-3.79
-10.49%
jan 1, 1993
35.809
+3.475
10.75%
jan 1, 1994
30.676
-5.134
-14.34%
jan 1, 1995
29.805
-0.87
-2.84%
jan 1, 1996
30.542
+0.737
2.47%
jan 1, 1997
28.028
-2.514
-8.23%
jan 1, 1998
30.553
+2.525
9.01%
jan 1, 1999
29.008
-1.544
-5.06%
jan 1, 2000
26.624
-2.385
-8.22%
jan 1, 2001
22.168
-4.455
-16.73%
jan 1, 2002
21.973
-0.195
-0.88%
jan 1, 2003
24.018
+2.045
9.31%
jan 1, 2004
23.567
-0.451
-1.88%
jan 1, 2005
21.793
-1.775
-7.53%
jan 1, 2014
16.004
-5.789
-26.56%
jan 1, 2015
16.059
+0.055
0.35%
jan 1, 2016
16.198
+0.138
0.86%
Ranking of countries by current statistics by years


Comments: