29
/
en
AIzaSyAYiBZKx7MnpbEhh9jyipgxe19OcubqV5w
April 1, 2024
153190
Hungary
HUN
true
2
1
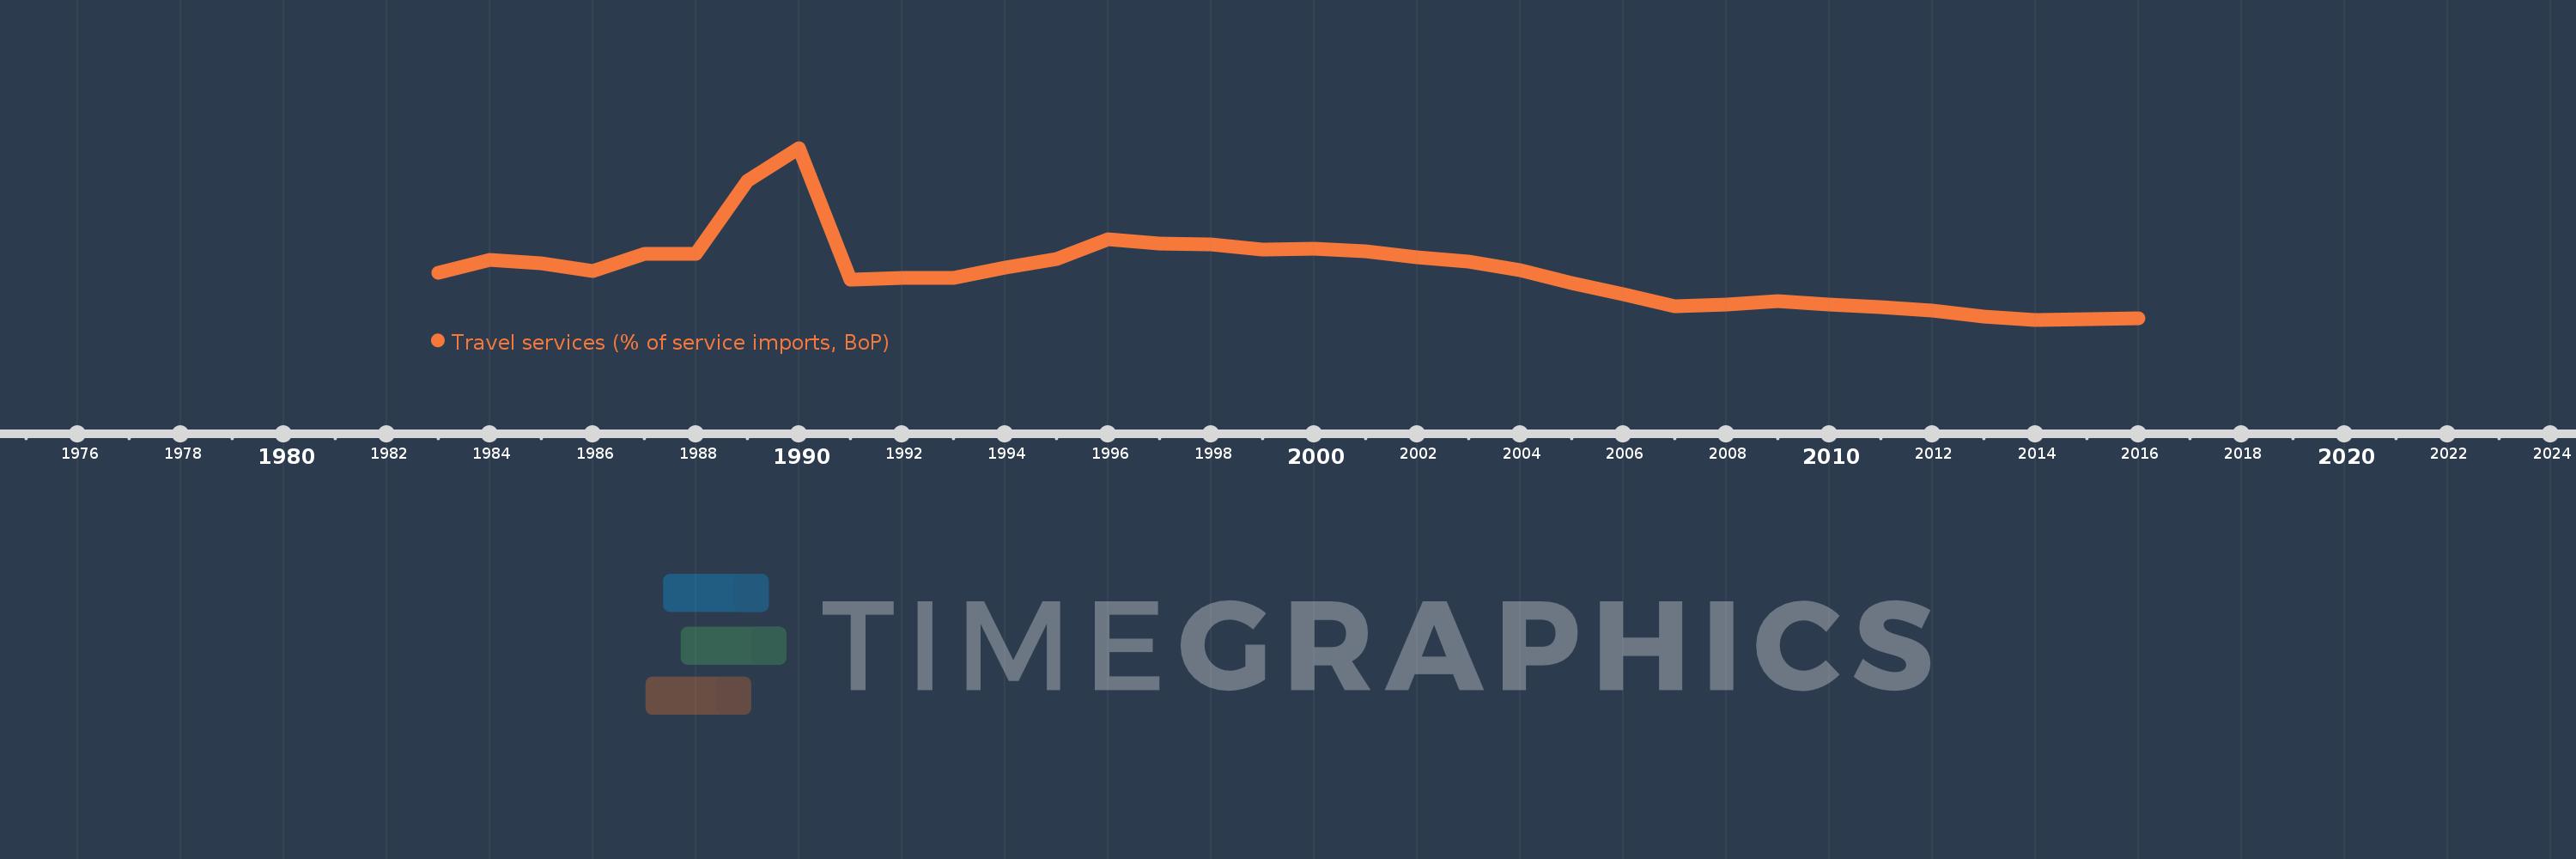
Travel services (% of service imports, BoP)
2016,2015,2014,2013,2012,2011,2010,2009,2008,2007,2006,2005,2004,2003,2002,2001,2000,1999,1998,1997,1996,1995,1994,1993,1992,1991,1990,1989,1988,1987,1986,1985,1984,1983
This statistics in other country:
AfghanistanAlbaniaAlgeriaAngolaAntigua and BarbudaArab WorldArgentinaArmeniaArubaAustraliaAustriaAzerbaijanBahamas, TheBahrainBangladeshBarbadosBelarusBelgiumBelizeBeninBermudaBhutanBoliviaBosnia and HerzegovinaBotswanaBrazilBrunei DarussalamBulgariaBurkina FasoBurundiCabo VerdeCambodiaCameroonCanadaCaribbean small statesCentral African RepublicCentral Europe and the BalticsChadChileChinaColombiaComorosCongo, Dem. Rep.Congo, Rep.Costa RicaCote d'IvoireCroatiaCuracaoCyprusCzech RepublicDenmarkDjiboutiDominicaDominican RepublicEarly-demographic dividendEast Asia & PacificEast Asia & Pacific (excluding high income)East Asia & Pacific (IDA & IBRD countries)EcuadorEgypt, Arab Rep.El SalvadorEritreaEstoniaEthiopiaEuro areaEurope & Central AsiaEurope & Central Asia (excluding high income)Europe & Central Asia (IDA & IBRD countries)European UnionFaroe IslandsFijiFinlandFragile and conflict affected situationsFranceFrench PolynesiaGabonGambia, TheGeorgiaGermanyGhanaGreeceGrenadaGuatemalaGuineaGuinea-BissauGuyanaHaitiHeavily indebted poor countries (HIPC)High incomeHondurasHong Kong SAR, ChinaHungaryIBRD onlyIcelandIDA & IBRD totalIDA onlyIDA totalIndiaIndonesiaIran, Islamic Rep.IraqIrelandIsraelItalyJamaicaJapanJordanKazakhstanKenyaKiribatiKorea, Rep.KosovoKuwaitKyrgyz RepublicLao PDRLate-demographic dividendLatin America & Caribbean Latin America & Caribbean (excluding high income)Latin America & the Caribbean (IDA & IBRD countries)LatviaLeast developed countries: UN classificationLebanonLesothoLiberiaLibyaLithuaniaLow & middle incomeLow incomeLower middle incomeLuxembourgMacao SAR, ChinaMacedonia, FYRMadagascarMalawiMalaysiaMaldivesMaliMaltaMarshall IslandsMauritaniaMauritiusMexicoMicronesia, Fed. Sts.Middle East & North AfricaMiddle East & North Africa (excluding high income)Middle East & North Africa (IDA & IBRD countries)Middle incomeMoldovaMongoliaMontenegroMoroccoMozambiqueMyanmarNamibiaNepalNetherlandsNew CaledoniaNew ZealandNicaraguaNigerNigeriaNorth AmericaNorwayOECD membersOmanOther small statesPacific island small statesPakistanPalauPanamaPapua New GuineaParaguayPeruPhilippinesPolandPortugalPost-demographic dividendPre-demographic dividendQatarRomaniaRussian FederationRwandaSamoaSao Tome and PrincipeSaudi ArabiaSenegalSerbiaSeychellesSierra LeoneSingaporeSint Maarten (Dutch part)Slovak RepublicSloveniaSmall statesSolomon IslandsSouth AfricaSouth AsiaSouth Asia (IDA & IBRD)South SudanSpainSri LankaSt. Kitts and NevisSt. LuciaSt. Vincent and the GrenadinesSub-Saharan Africa Sub-Saharan Africa (excluding high income)Sub-Saharan Africa (IDA & IBRD countries)SudanSurinameSwazilandSwedenSwitzerlandSyrian Arab RepublicTajikistanTanzaniaThailandTimor-LesteTogoTongaTrinidad and TobagoTunisiaTurkeyTuvaluUgandaUkraineUnited KingdomUnited StatesUpper middle incomeUruguayVanuatuVenezuela, RBWest Bank and GazaWorldYemen, Rep.ZambiaZimbabwe Timeline:
This timeline shows a graph from 1983 to 2016 of Hungary. No data until 1982. Number of actual observations by date: 34.
Source name:
World Development Indicators
Source organization:
International Monetary Fund, Balance of Payments Statistics Yearbook and data files.
Categories, topics:
Economy & Growth, Trade
Last updated:
apr 23, 2017
Indicators value changes by year
Minimum:
10.986
jan 1, 2014
Maximum:
68.998
jan 1, 1990
At the date of observation
Value
Absolute change
Change from previous value
jan 1, 1983
26.909
+26.909
0.0%
jan 1, 1984
31.133
+4.224
15.7%
jan 1, 1985
30.072
-1.061
-3.41%
jan 1, 1986
27.525
-2.547
-8.47%
jan 1, 1987
33.239
+5.714
20.76%
jan 1, 1988
33.169
-0.07
-0.21%
jan 1, 1989
57.947
+24.777
74.7%
jan 1, 1990
68.998
+11.052
19.07%
jan 1, 1991
24.391
-44.608
-64.65%
jan 1, 1992
24.982
+0.591
2.42%
jan 1, 1993
25.14
+0.159
0.64%
jan 1, 1994
28.463
+3.323
13.22%
jan 1, 1995
31.613
+3.149
11.06%
jan 1, 1996
38.271
+6.658
21.06%
jan 1, 1997
36.837
-1.434
-3.75%
jan 1, 1998
36.509
-0.328
-0.89%
jan 1, 1999
34.783
-1.726
-4.73%
jan 1, 2000
35.011
+0.229
0.66%
jan 1, 2001
34.166
-0.845
-2.41%
jan 1, 2002
32.144
-2.022
-5.92%
jan 1, 2003
30.668
-1.477
-4.59%
jan 1, 2004
27.859
-2.809
-9.16%
jan 1, 2005
23.295
-4.564
-16.38%
jan 1, 2006
19.741
-3.554
-15.26%
jan 1, 2007
15.474
-4.267
-21.62%
jan 1, 2008
16.08
+0.606
3.92%
jan 1, 2009
17.42
+1.34
8.34%
jan 1, 2010
16.235
-1.185
-6.8%
jan 1, 2011
15.111
-1.124
-6.92%
jan 1, 2012
14.012
-1.099
-7.27%
jan 1, 2013
11.97
-2.042
-14.57%
jan 1, 2014
10.986
-0.984
-8.22%
jan 1, 2015
11.223
+0.237
2.16%
jan 1, 2016
11.414
+0.191
1.7%
Ranking of countries by current statistics by years


Comments: