29
/
en
AIzaSyAYiBZKx7MnpbEhh9jyipgxe19OcubqV5w
April 1, 2024
106752
China
CHN
true
2
1
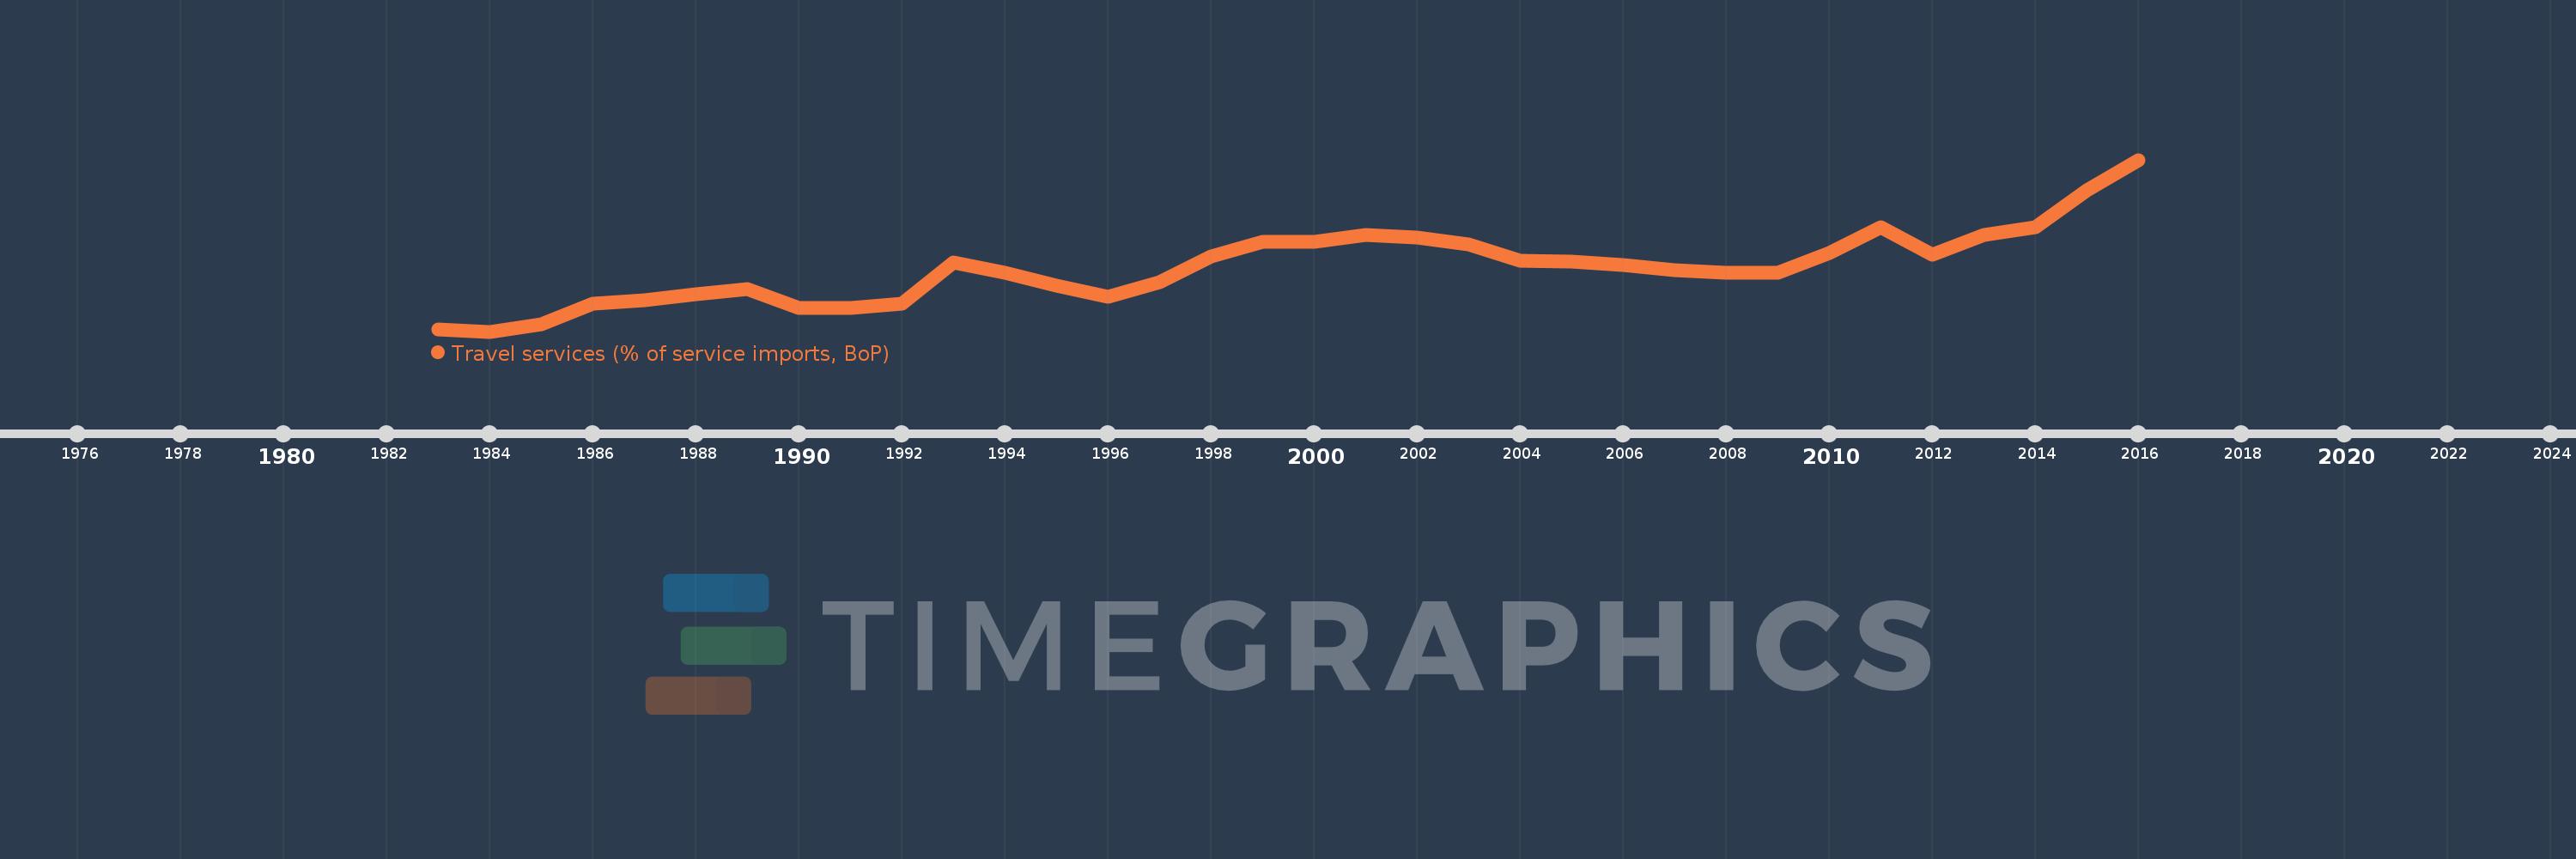
Travel services (% of service imports, BoP)
2016,2015,2014,2013,2012,2011,2010,2009,2008,2007,2006,2005,2004,2003,2002,2001,2000,1999,1998,1997,1996,1995,1994,1993,1992,1991,1990,1989,1988,1987,1986,1985,1984,1983
This statistics in other country:
AfghanistanAlbaniaAlgeriaAngolaAntigua and BarbudaArab WorldArgentinaArmeniaArubaAustraliaAustriaAzerbaijanBahamas, TheBahrainBangladeshBarbadosBelarusBelgiumBelizeBeninBermudaBhutanBoliviaBosnia and HerzegovinaBotswanaBrazilBrunei DarussalamBulgariaBurkina FasoBurundiCabo VerdeCambodiaCameroonCanadaCaribbean small statesCentral African RepublicCentral Europe and the BalticsChadChileChinaColombiaComorosCongo, Dem. Rep.Congo, Rep.Costa RicaCote d'IvoireCroatiaCuracaoCyprusCzech RepublicDenmarkDjiboutiDominicaDominican RepublicEarly-demographic dividendEast Asia & PacificEast Asia & Pacific (excluding high income)East Asia & Pacific (IDA & IBRD countries)EcuadorEgypt, Arab Rep.El SalvadorEritreaEstoniaEthiopiaEuro areaEurope & Central AsiaEurope & Central Asia (excluding high income)Europe & Central Asia (IDA & IBRD countries)European UnionFaroe IslandsFijiFinlandFragile and conflict affected situationsFranceFrench PolynesiaGabonGambia, TheGeorgiaGermanyGhanaGreeceGrenadaGuatemalaGuineaGuinea-BissauGuyanaHaitiHeavily indebted poor countries (HIPC)High incomeHondurasHong Kong SAR, ChinaHungaryIBRD onlyIcelandIDA & IBRD totalIDA onlyIDA totalIndiaIndonesiaIran, Islamic Rep.IraqIrelandIsraelItalyJamaicaJapanJordanKazakhstanKenyaKiribatiKorea, Rep.KosovoKuwaitKyrgyz RepublicLao PDRLate-demographic dividendLatin America & Caribbean Latin America & Caribbean (excluding high income)Latin America & the Caribbean (IDA & IBRD countries)LatviaLeast developed countries: UN classificationLebanonLesothoLiberiaLibyaLithuaniaLow & middle incomeLow incomeLower middle incomeLuxembourgMacao SAR, ChinaMacedonia, FYRMadagascarMalawiMalaysiaMaldivesMaliMaltaMarshall IslandsMauritaniaMauritiusMexicoMicronesia, Fed. Sts.Middle East & North AfricaMiddle East & North Africa (excluding high income)Middle East & North Africa (IDA & IBRD countries)Middle incomeMoldovaMongoliaMontenegroMoroccoMozambiqueMyanmarNamibiaNepalNetherlandsNew CaledoniaNew ZealandNicaraguaNigerNigeriaNorth AmericaNorwayOECD membersOmanOther small statesPacific island small statesPakistanPalauPanamaPapua New GuineaParaguayPeruPhilippinesPolandPortugalPost-demographic dividendPre-demographic dividendQatarRomaniaRussian FederationRwandaSamoaSao Tome and PrincipeSaudi ArabiaSenegalSerbiaSeychellesSierra LeoneSingaporeSint Maarten (Dutch part)Slovak RepublicSloveniaSmall statesSolomon IslandsSouth AfricaSouth AsiaSouth Asia (IDA & IBRD)South SudanSpainSri LankaSt. Kitts and NevisSt. LuciaSt. Vincent and the GrenadinesSub-Saharan Africa Sub-Saharan Africa (excluding high income)Sub-Saharan Africa (IDA & IBRD countries)SudanSurinameSwazilandSwedenSwitzerlandSyrian Arab RepublicTajikistanTanzaniaThailandTimor-LesteTogoTongaTrinidad and TobagoTunisiaTurkeyTuvaluUgandaUkraineUnited KingdomUnited StatesUpper middle incomeUruguayVanuatuVenezuela, RBWest Bank and GazaWorldYemen, Rep.ZambiaZimbabwe Timeline:
This timeline shows a graph from 1983 to 2016 of China. No data until 1982. Number of actual observations by date: 34.
Source name:
World Development Indicators
Source organization:
International Monetary Fund, Balance of Payments Statistics Yearbook and data files.
Categories, topics:
Economy & Growth, Trade
Last updated:
apr 23, 2017
Indicators value changes by year
Maximum:
62.317
jan 1, 2016
At the date of observation
Value
Absolute change
Change from previous value
jan 1, 1983
3.261
+3.261
0.0%
jan 1, 1984
2.658
-0.603
-18.49%
jan 1, 1985
5.25
+2.592
97.53%
jan 1, 1986
12.441
+7.19
136.95%
jan 1, 1987
13.533
+1.092
8.78%
jan 1, 1988
15.573
+2.041
15.08%
jan 1, 1989
17.569
+1.995
12.81%
jan 1, 1990
10.972
-6.597
-37.55%
jan 1, 1991
10.8
-0.172
-1.57%
jan 1, 1992
12.4
+1.6
14.82%
jan 1, 1993
26.627
+14.227
114.74%
jan 1, 1994
23.239
-3.388
-12.73%
jan 1, 1995
18.627
-4.612
-19.85%
jan 1, 1996
14.62
-4.007
-21.51%
jan 1, 1997
19.81
+5.189
35.49%
jan 1, 1998
28.75
+8.941
45.13%
jan 1, 1999
33.837
+5.087
17.69%
jan 1, 2000
33.837
0.0
0.0%
jan 1, 2001
36.157
+2.32
6.86%
jan 1, 2002
35.251
-0.906
-2.51%
jan 1, 2003
32.928
-2.323
-6.59%
jan 1, 2004
27.341
-5.586
-16.97%
jan 1, 2005
27.082
-0.26
-0.95%
jan 1, 2006
25.913
-1.169
-4.32%
jan 1, 2007
24.12
-1.793
-6.92%
jan 1, 2008
23.067
-1.052
-4.36%
jan 1, 2009
23.119
+0.051
0.22%
jan 1, 2010
29.937
+6.818
29.49%
jan 1, 2011
38.94
+9.003
30.07%
jan 1, 2012
29.287
-9.654
-24.79%
jan 1, 2013
36.252
+6.965
23.78%
jan 1, 2014
38.891
+2.639
7.28%
jan 1, 2015
51.821
+12.93
33.25%
jan 1, 2016
62.317
+10.496
20.25%
Ranking of countries by current statistics by years


Comments: