29
/
en
AIzaSyAYiBZKx7MnpbEhh9jyipgxe19OcubqV5w
April 1, 2024
280501
Vanuatu
VUT
true
2
1
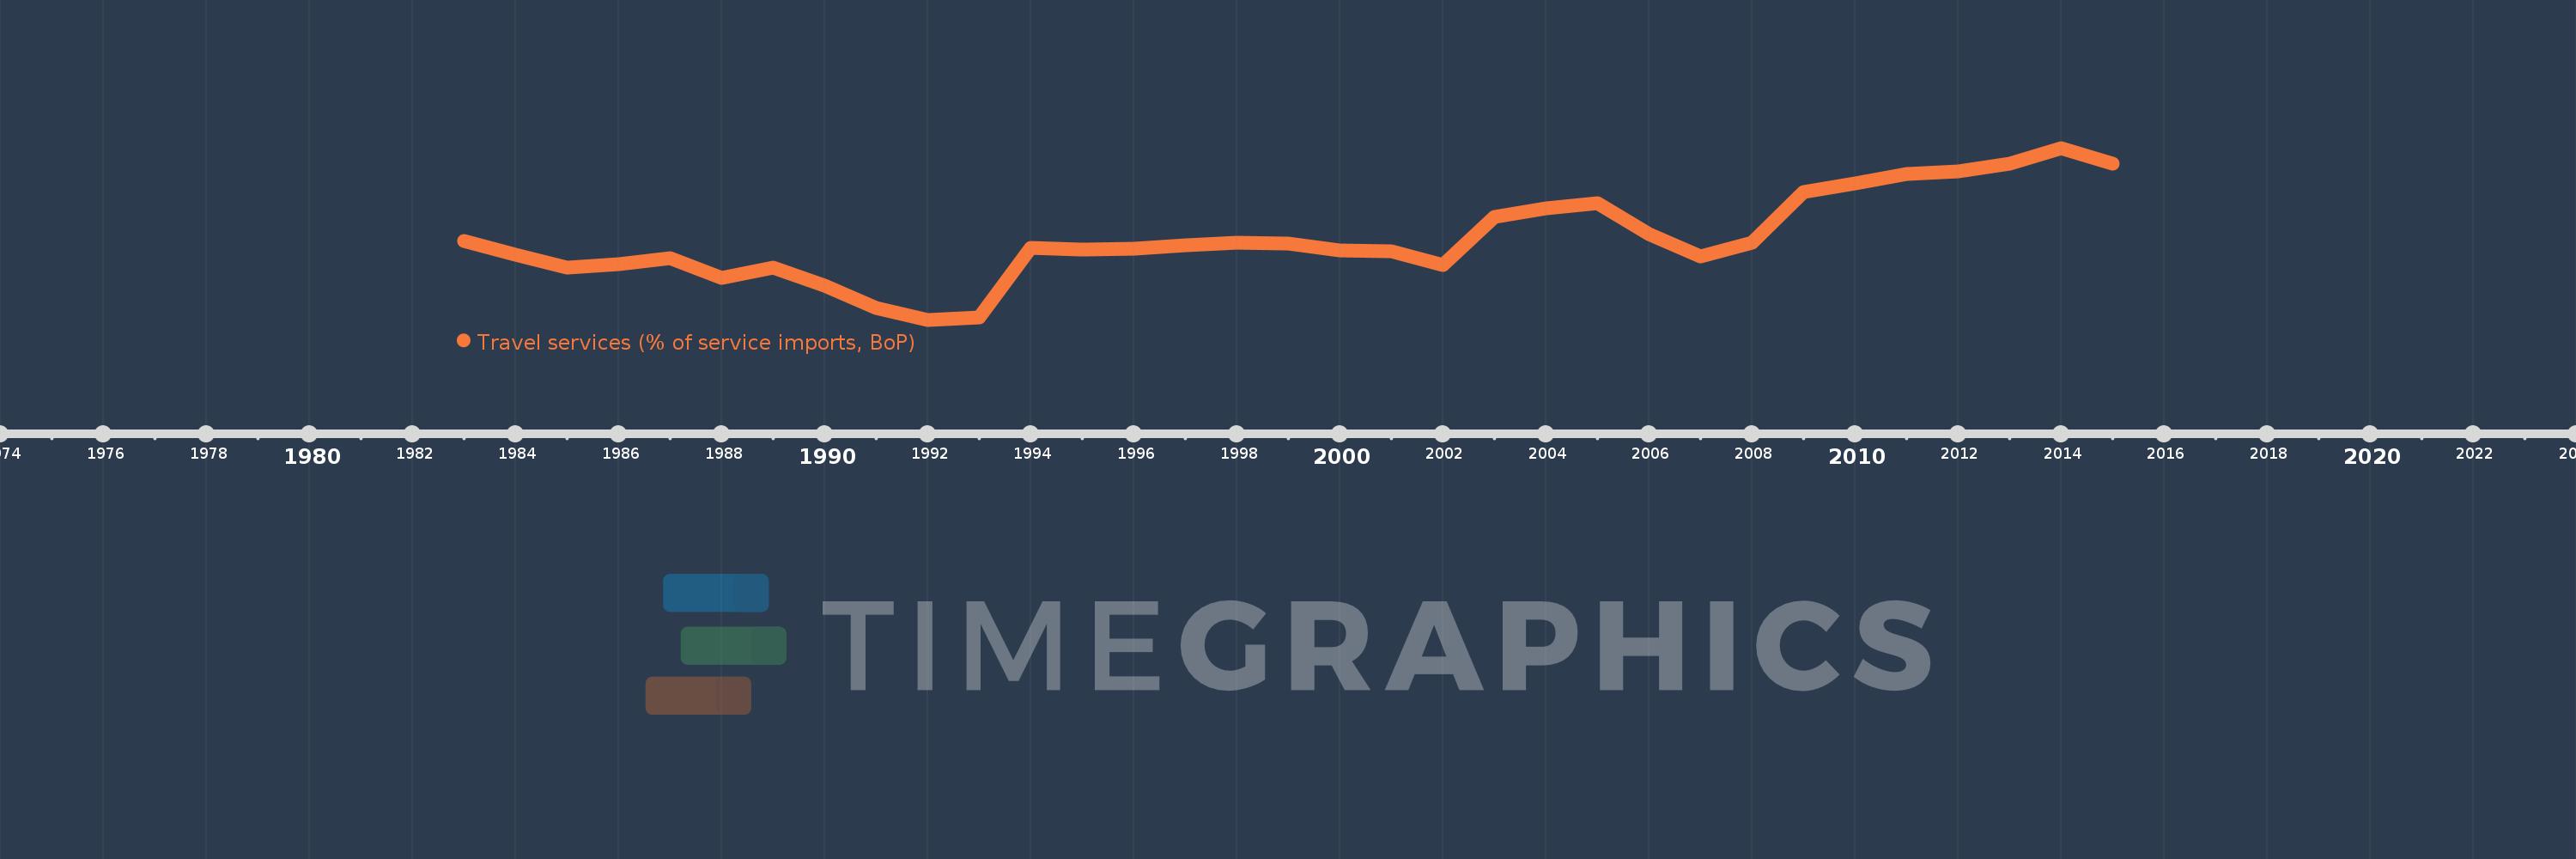
Travel services (% of service imports, BoP)
2015,2014,2013,2012,2011,2010,2009,2008,2007,2006,2005,2004,2003,2002,2001,2000,1999,1998,1997,1996,1995,1994,1993,1992,1991,1990,1989,1988,1987,1986,1985,1984,1983
This statistics in other country:
AfghanistanAlbaniaAlgeriaAngolaAntigua and BarbudaArab WorldArgentinaArmeniaArubaAustraliaAustriaAzerbaijanBahamas, TheBahrainBangladeshBarbadosBelarusBelgiumBelizeBeninBermudaBhutanBoliviaBosnia and HerzegovinaBotswanaBrazilBrunei DarussalamBulgariaBurkina FasoBurundiCabo VerdeCambodiaCameroonCanadaCaribbean small statesCentral African RepublicCentral Europe and the BalticsChadChileChinaColombiaComorosCongo, Dem. Rep.Congo, Rep.Costa RicaCote d'IvoireCroatiaCuracaoCyprusCzech RepublicDenmarkDjiboutiDominicaDominican RepublicEarly-demographic dividendEast Asia & PacificEast Asia & Pacific (excluding high income)East Asia & Pacific (IDA & IBRD countries)EcuadorEgypt, Arab Rep.El SalvadorEritreaEstoniaEthiopiaEuro areaEurope & Central AsiaEurope & Central Asia (excluding high income)Europe & Central Asia (IDA & IBRD countries)European UnionFaroe IslandsFijiFinlandFragile and conflict affected situationsFranceFrench PolynesiaGabonGambia, TheGeorgiaGermanyGhanaGreeceGrenadaGuatemalaGuineaGuinea-BissauGuyanaHaitiHeavily indebted poor countries (HIPC)High incomeHondurasHong Kong SAR, ChinaHungaryIBRD onlyIcelandIDA & IBRD totalIDA onlyIDA totalIndiaIndonesiaIran, Islamic Rep.IraqIrelandIsraelItalyJamaicaJapanJordanKazakhstanKenyaKiribatiKorea, Rep.KosovoKuwaitKyrgyz RepublicLao PDRLate-demographic dividendLatin America & Caribbean Latin America & Caribbean (excluding high income)Latin America & the Caribbean (IDA & IBRD countries)LatviaLeast developed countries: UN classificationLebanonLesothoLiberiaLibyaLithuaniaLow & middle incomeLow incomeLower middle incomeLuxembourgMacao SAR, ChinaMacedonia, FYRMadagascarMalawiMalaysiaMaldivesMaliMaltaMarshall IslandsMauritaniaMauritiusMexicoMicronesia, Fed. Sts.Middle East & North AfricaMiddle East & North Africa (excluding high income)Middle East & North Africa (IDA & IBRD countries)Middle incomeMoldovaMongoliaMontenegroMoroccoMozambiqueMyanmarNamibiaNepalNetherlandsNew CaledoniaNew ZealandNicaraguaNigerNigeriaNorth AmericaNorwayOECD membersOmanOther small statesPacific island small statesPakistanPalauPanamaPapua New GuineaParaguayPeruPhilippinesPolandPortugalPost-demographic dividendPre-demographic dividendQatarRomaniaRussian FederationRwandaSamoaSao Tome and PrincipeSaudi ArabiaSenegalSerbiaSeychellesSierra LeoneSingaporeSint Maarten (Dutch part)Slovak RepublicSloveniaSmall statesSolomon IslandsSouth AfricaSouth AsiaSouth Asia (IDA & IBRD)South SudanSpainSri LankaSt. Kitts and NevisSt. LuciaSt. Vincent and the GrenadinesSub-Saharan Africa Sub-Saharan Africa (excluding high income)Sub-Saharan Africa (IDA & IBRD countries)SudanSurinameSwazilandSwedenSwitzerlandSyrian Arab RepublicTajikistanTanzaniaThailandTimor-LesteTogoTongaTrinidad and TobagoTunisiaTurkeyTuvaluUgandaUkraineUnited KingdomUnited StatesUpper middle incomeUruguayVanuatuVenezuela, RBWest Bank and GazaWorldYemen, Rep.ZambiaZimbabwe Timeline:
This timeline shows a graph from 1983 to 2015 of Vanuatu. No data until 1982. Number of actual observations by date: 33.
Source name:
World Development Indicators
Source organization:
International Monetary Fund, Balance of Payments Statistics Yearbook and data files.
Categories, topics:
Economy & Growth, Trade
Last updated:
apr 23, 2017
Indicators value changes by year
Maximum:
27.695
jan 1, 2014
At the date of observation
Value
Absolute change
Change from previous value
jan 1, 1983
14.193
+14.193
0.0%
jan 1, 1984
12.208
-1.984
-13.98%
jan 1, 1985
10.321
-1.887
-15.46%
jan 1, 1986
10.924
+0.603
5.84%
jan 1, 1987
11.754
+0.83
7.6%
jan 1, 1988
8.851
-2.903
-24.7%
jan 1, 1989
10.428
+1.577
17.82%
jan 1, 1990
7.794
-2.634
-25.26%
jan 1, 1991
4.48
-3.314
-42.52%
jan 1, 1992
2.826
-1.654
-36.91%
jan 1, 1993
3.219
+0.393
13.89%
jan 1, 1994
13.201
+9.982
310.09%
jan 1, 1995
12.972
-0.229
-1.73%
jan 1, 1996
13.068
+0.095
0.74%
jan 1, 1997
13.632
+0.564
4.31%
jan 1, 1998
13.984
+0.353
2.59%
jan 1, 1999
13.815
-0.169
-1.21%
jan 1, 2000
12.887
-0.928
-6.72%
jan 1, 2001
12.681
-0.205
-1.59%
jan 1, 2002
10.793
-1.888
-14.89%
jan 1, 2003
17.666
+6.873
63.68%
jan 1, 2004
19.005
+1.339
7.58%
jan 1, 2005
19.738
+0.733
3.86%
jan 1, 2006
15.168
-4.571
-23.16%
jan 1, 2007
11.994
-3.173
-20.92%
jan 1, 2008
14.035
+2.04
17.01%
jan 1, 2009
21.302
+7.267
51.78%
jan 1, 2010
22.516
+1.214
5.7%
jan 1, 2011
23.929
+1.413
6.28%
jan 1, 2012
24.295
+0.365
1.53%
jan 1, 2013
25.41
+1.116
4.59%
jan 1, 2014
27.695
+2.285
8.99%
jan 1, 2015
25.376
-2.32
-8.38%
Ranking of countries by current statistics by years


Comments: