29
/
en
AIzaSyAYiBZKx7MnpbEhh9jyipgxe19OcubqV5w
April 1, 2024
146433
Guinea
GIN
true
2
1
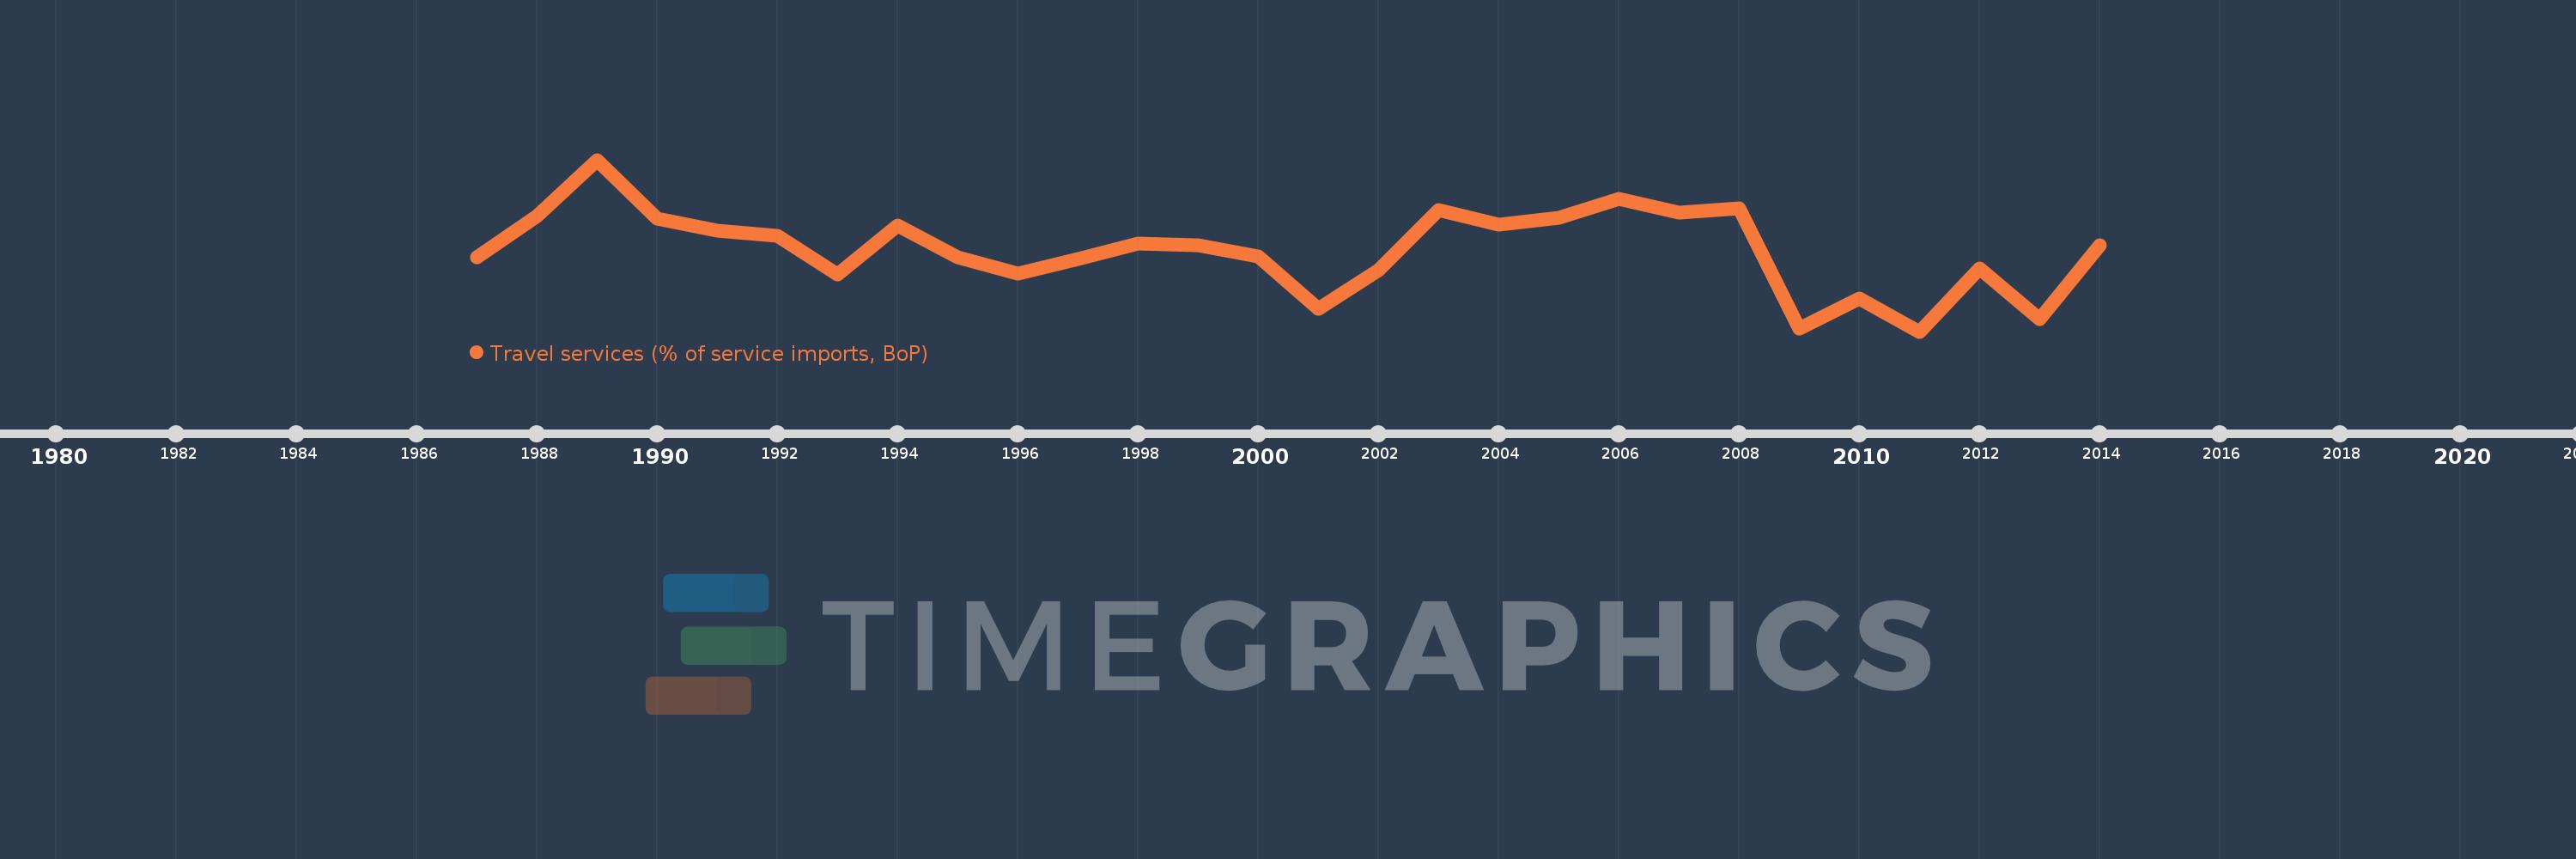
Travel services (% of service imports, BoP)
2014,2013,2012,2011,2010,2009,2008,2007,2006,2005,2004,2003,2002,2001,2000,1999,1998,1997,1996,1995,1994,1993,1992,1991,1990,1989,1988,1987
This statistics in other country:
AfghanistanAlbaniaAlgeriaAngolaAntigua and BarbudaArab WorldArgentinaArmeniaArubaAustraliaAustriaAzerbaijanBahamas, TheBahrainBangladeshBarbadosBelarusBelgiumBelizeBeninBermudaBhutanBoliviaBosnia and HerzegovinaBotswanaBrazilBrunei DarussalamBulgariaBurkina FasoBurundiCabo VerdeCambodiaCameroonCanadaCaribbean small statesCentral African RepublicCentral Europe and the BalticsChadChileChinaColombiaComorosCongo, Dem. Rep.Congo, Rep.Costa RicaCote d'IvoireCroatiaCuracaoCyprusCzech RepublicDenmarkDjiboutiDominicaDominican RepublicEarly-demographic dividendEast Asia & PacificEast Asia & Pacific (excluding high income)East Asia & Pacific (IDA & IBRD countries)EcuadorEgypt, Arab Rep.El SalvadorEritreaEstoniaEthiopiaEuro areaEurope & Central AsiaEurope & Central Asia (excluding high income)Europe & Central Asia (IDA & IBRD countries)European UnionFaroe IslandsFijiFinlandFragile and conflict affected situationsFranceFrench PolynesiaGabonGambia, TheGeorgiaGermanyGhanaGreeceGrenadaGuatemalaGuineaGuinea-BissauGuyanaHaitiHeavily indebted poor countries (HIPC)High incomeHondurasHong Kong SAR, ChinaHungaryIBRD onlyIcelandIDA & IBRD totalIDA onlyIDA totalIndiaIndonesiaIran, Islamic Rep.IraqIrelandIsraelItalyJamaicaJapanJordanKazakhstanKenyaKiribatiKorea, Rep.KosovoKuwaitKyrgyz RepublicLao PDRLate-demographic dividendLatin America & Caribbean Latin America & Caribbean (excluding high income)Latin America & the Caribbean (IDA & IBRD countries)LatviaLeast developed countries: UN classificationLebanonLesothoLiberiaLibyaLithuaniaLow & middle incomeLow incomeLower middle incomeLuxembourgMacao SAR, ChinaMacedonia, FYRMadagascarMalawiMalaysiaMaldivesMaliMaltaMarshall IslandsMauritaniaMauritiusMexicoMicronesia, Fed. Sts.Middle East & North AfricaMiddle East & North Africa (excluding high income)Middle East & North Africa (IDA & IBRD countries)Middle incomeMoldovaMongoliaMontenegroMoroccoMozambiqueMyanmarNamibiaNepalNetherlandsNew CaledoniaNew ZealandNicaraguaNigerNigeriaNorth AmericaNorwayOECD membersOmanOther small statesPacific island small statesPakistanPalauPanamaPapua New GuineaParaguayPeruPhilippinesPolandPortugalPost-demographic dividendPre-demographic dividendQatarRomaniaRussian FederationRwandaSamoaSao Tome and PrincipeSaudi ArabiaSenegalSerbiaSeychellesSierra LeoneSingaporeSint Maarten (Dutch part)Slovak RepublicSloveniaSmall statesSolomon IslandsSouth AfricaSouth AsiaSouth Asia (IDA & IBRD)South SudanSpainSri LankaSt. Kitts and NevisSt. LuciaSt. Vincent and the GrenadinesSub-Saharan Africa Sub-Saharan Africa (excluding high income)Sub-Saharan Africa (IDA & IBRD countries)SudanSurinameSwazilandSwedenSwitzerlandSyrian Arab RepublicTajikistanTanzaniaThailandTimor-LesteTogoTongaTrinidad and TobagoTunisiaTurkeyTuvaluUgandaUkraineUnited KingdomUnited StatesUpper middle incomeUruguayVanuatuVenezuela, RBWest Bank and GazaWorldYemen, Rep.ZambiaZimbabwe Timeline:
This timeline shows a graph from 1987 to 2014 of Guinea. No data until 1986. Number of actual observations by date: 28.
Source name:
World Development Indicators
Source organization:
International Monetary Fund, Balance of Payments Statistics Yearbook and data files.
Categories, topics:
Economy & Growth, Trade
Last updated:
apr 23, 2017
Indicators value changes by year
Maximum:
12.409
jan 1, 1989
At the date of observation
Value
Absolute change
Change from previous value
jan 1, 1987
6.443
+6.443
0.0%
jan 1, 1988
8.974
+2.531
39.28%
jan 1, 1989
12.409
+3.435
38.28%
jan 1, 1990
8.804
-3.605
-29.05%
jan 1, 1991
8.041
-0.763
-8.67%
jan 1, 1992
7.769
-0.272
-3.38%
jan 1, 1993
5.379
-2.39
-30.77%
jan 1, 1994
8.376
+2.997
55.73%
jan 1, 1995
6.429
-1.948
-23.25%
jan 1, 1996
5.445
-0.983
-15.3%
jan 1, 1997
6.302
+0.857
15.73%
jan 1, 1998
7.249
+0.947
15.02%
jan 1, 1999
7.174
-0.074
-1.02%
jan 1, 2000
6.474
-0.701
-9.77%
jan 1, 2001
3.243
-3.231
-49.9%
jan 1, 2002
5.612
+2.369
73.04%
jan 1, 2003
9.308
+3.696
65.86%
jan 1, 2004
8.456
-0.851
-9.15%
jan 1, 2005
8.856
+0.4
4.73%
jan 1, 2006
10.008
+1.152
13.01%
jan 1, 2007
9.169
-0.839
-8.38%
jan 1, 2008
9.451
+0.282
3.08%
jan 1, 2009
2.071
-7.38
-78.09%
jan 1, 2010
3.892
+1.822
87.96%
jan 1, 2011
1.871
-2.022
-51.94%
jan 1, 2012
5.744
+3.873
207.03%
jan 1, 2013
2.625
-3.119
-54.3%
jan 1, 2014
7.167
+4.542
173.03%
Ranking of countries by current statistics by years


Comments: