29
/
en
AIzaSyAYiBZKx7MnpbEhh9jyipgxe19OcubqV5w
April 1, 2024
196398
Mexico
MEX
true
2
1
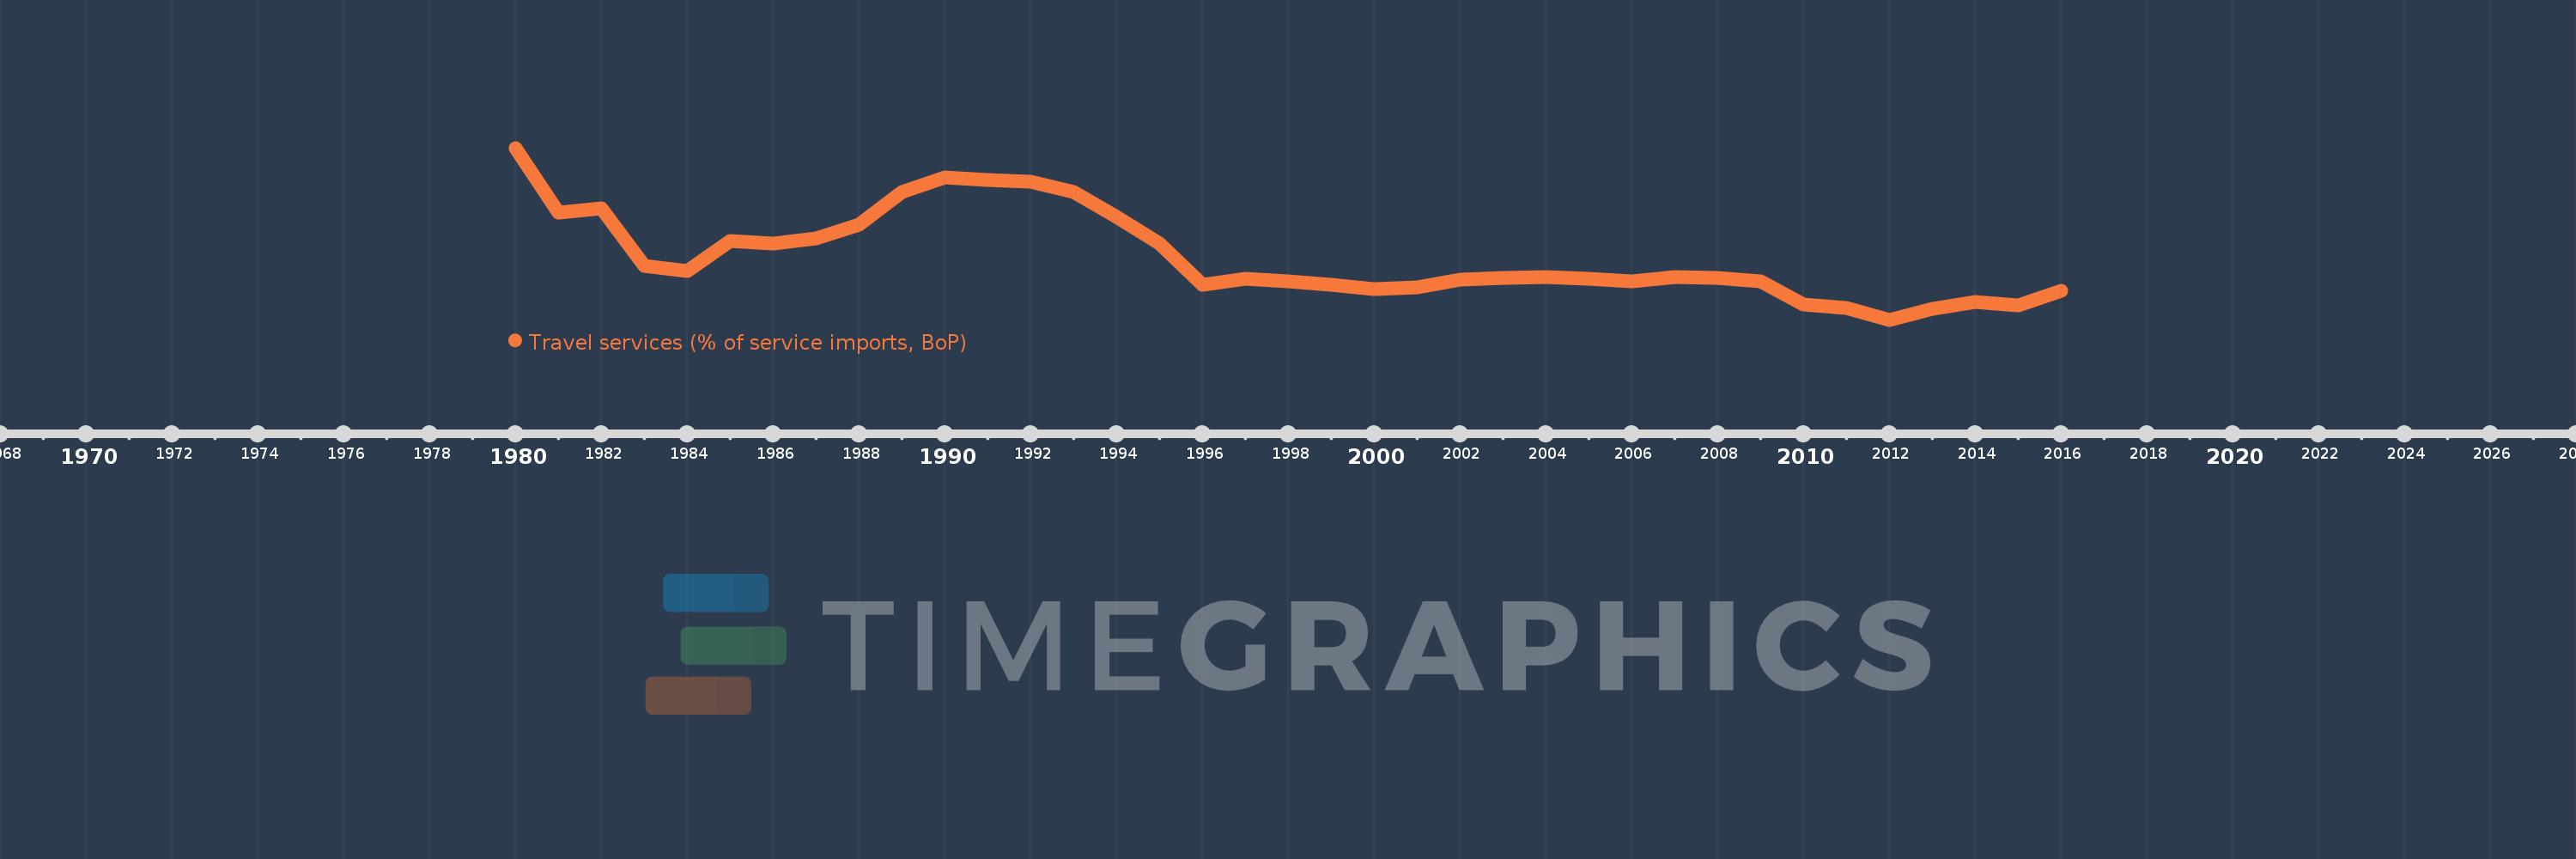
Travel services (% of service imports, BoP)
2016,2015,2014,2013,2012,2011,2010,2009,2008,2007,2006,2005,2004,2003,2002,2001,2000,1999,1998,1997,1996,1995,1994,1993,1992,1991,1990,1989,1988,1987,1986,1985,1984,1983,1982,1981,1980
This statistics in other country:
AfghanistanAlbaniaAlgeriaAngolaAntigua and BarbudaArab WorldArgentinaArmeniaArubaAustraliaAustriaAzerbaijanBahamas, TheBahrainBangladeshBarbadosBelarusBelgiumBelizeBeninBermudaBhutanBoliviaBosnia and HerzegovinaBotswanaBrazilBrunei DarussalamBulgariaBurkina FasoBurundiCabo VerdeCambodiaCameroonCanadaCaribbean small statesCentral African RepublicCentral Europe and the BalticsChadChileChinaColombiaComorosCongo, Dem. Rep.Congo, Rep.Costa RicaCote d'IvoireCroatiaCuracaoCyprusCzech RepublicDenmarkDjiboutiDominicaDominican RepublicEarly-demographic dividendEast Asia & PacificEast Asia & Pacific (excluding high income)East Asia & Pacific (IDA & IBRD countries)EcuadorEgypt, Arab Rep.El SalvadorEritreaEstoniaEthiopiaEuro areaEurope & Central AsiaEurope & Central Asia (excluding high income)Europe & Central Asia (IDA & IBRD countries)European UnionFaroe IslandsFijiFinlandFragile and conflict affected situationsFranceFrench PolynesiaGabonGambia, TheGeorgiaGermanyGhanaGreeceGrenadaGuatemalaGuineaGuinea-BissauGuyanaHaitiHeavily indebted poor countries (HIPC)High incomeHondurasHong Kong SAR, ChinaHungaryIBRD onlyIcelandIDA & IBRD totalIDA onlyIDA totalIndiaIndonesiaIran, Islamic Rep.IraqIrelandIsraelItalyJamaicaJapanJordanKazakhstanKenyaKiribatiKorea, Rep.KosovoKuwaitKyrgyz RepublicLao PDRLate-demographic dividendLatin America & Caribbean Latin America & Caribbean (excluding high income)Latin America & the Caribbean (IDA & IBRD countries)LatviaLeast developed countries: UN classificationLebanonLesothoLiberiaLibyaLithuaniaLow & middle incomeLow incomeLower middle incomeLuxembourgMacao SAR, ChinaMacedonia, FYRMadagascarMalawiMalaysiaMaldivesMaliMaltaMarshall IslandsMauritaniaMauritiusMexicoMicronesia, Fed. Sts.Middle East & North AfricaMiddle East & North Africa (excluding high income)Middle East & North Africa (IDA & IBRD countries)Middle incomeMoldovaMongoliaMontenegroMoroccoMozambiqueMyanmarNamibiaNepalNetherlandsNew CaledoniaNew ZealandNicaraguaNigerNigeriaNorth AmericaNorwayOECD membersOmanOther small statesPacific island small statesPakistanPalauPanamaPapua New GuineaParaguayPeruPhilippinesPolandPortugalPost-demographic dividendPre-demographic dividendQatarRomaniaRussian FederationRwandaSamoaSao Tome and PrincipeSaudi ArabiaSenegalSerbiaSeychellesSierra LeoneSingaporeSint Maarten (Dutch part)Slovak RepublicSloveniaSmall statesSolomon IslandsSouth AfricaSouth AsiaSouth Asia (IDA & IBRD)South SudanSpainSri LankaSt. Kitts and NevisSt. LuciaSt. Vincent and the GrenadinesSub-Saharan Africa Sub-Saharan Africa (excluding high income)Sub-Saharan Africa (IDA & IBRD countries)SudanSurinameSwazilandSwedenSwitzerlandSyrian Arab RepublicTajikistanTanzaniaThailandTimor-LesteTogoTongaTrinidad and TobagoTunisiaTurkeyTuvaluUgandaUkraineUnited KingdomUnited StatesUpper middle incomeUruguayVanuatuVenezuela, RBWest Bank and GazaWorldYemen, Rep.ZambiaZimbabwe Timeline:
This timeline shows a graph from 1980 to 2016 of Mexico. No data until 1979. Number of actual observations by date: 37.
Source name:
World Development Indicators
Source organization:
International Monetary Fund, Balance of Payments Statistics Yearbook and data files.
Categories, topics:
Economy & Growth, Trade
Last updated:
apr 23, 2017
Indicators value changes by year
Minimum:
25.784
jan 1, 2012
Maximum:
59.763
jan 1, 1980
At the date of observation
Value
Absolute change
Change from previous value
jan 1, 1980
59.763
+59.763
0.0%
jan 1, 1981
46.991
-12.772
-21.37%
jan 1, 1982
47.862
+0.871
1.85%
jan 1, 1983
36.416
-11.446
-23.91%
jan 1, 1984
35.358
-1.058
-2.9%
jan 1, 1985
41.414
+6.055
17.12%
jan 1, 1986
40.894
-0.519
-1.25%
jan 1, 1987
41.952
+1.058
2.59%
jan 1, 1988
44.52
+2.568
6.12%
jan 1, 1989
50.979
+6.459
14.51%
jan 1, 1990
53.896
+2.917
5.72%
jan 1, 1991
53.473
-0.423
-0.79%
jan 1, 1992
53.034
-0.439
-0.82%
jan 1, 1993
51.066
-1.968
-3.71%
jan 1, 1994
46.173
-4.893
-9.58%
jan 1, 1995
40.925
-5.248
-11.37%
jan 1, 1996
32.634
-8.291
-20.26%
jan 1, 1997
33.971
+1.336
4.09%
jan 1, 1998
33.405
-0.565
-1.66%
jan 1, 1999
32.774
-0.631
-1.89%
jan 1, 2000
31.768
-1.006
-3.07%
jan 1, 2001
32.24
+0.472
1.49%
jan 1, 2002
33.681
+1.44
4.47%
jan 1, 2003
34.026
+0.345
1.02%
jan 1, 2004
34.175
+0.149
0.44%
jan 1, 2005
33.869
-0.306
-0.9%
jan 1, 2006
33.329
-0.54
-1.59%
jan 1, 2007
34.297
+0.968
2.91%
jan 1, 2008
33.976
-0.321
-0.94%
jan 1, 2009
33.404
-0.573
-1.69%
jan 1, 2010
28.78
-4.623
-13.84%
jan 1, 2011
28.129
-0.652
-2.26%
jan 1, 2012
25.784
-2.344
-8.33%
jan 1, 2013
28.022
+2.238
8.68%
jan 1, 2014
29.26
+1.238
4.42%
jan 1, 2015
28.642
-0.618
-2.11%
jan 1, 2016
31.5
+2.858
9.98%
Ranking of countries by current statistics by years


Comments: