29
/
en
AIzaSyAYiBZKx7MnpbEhh9jyipgxe19OcubqV5w
April 1, 2024
33955
European Union
EUU
false
2
1
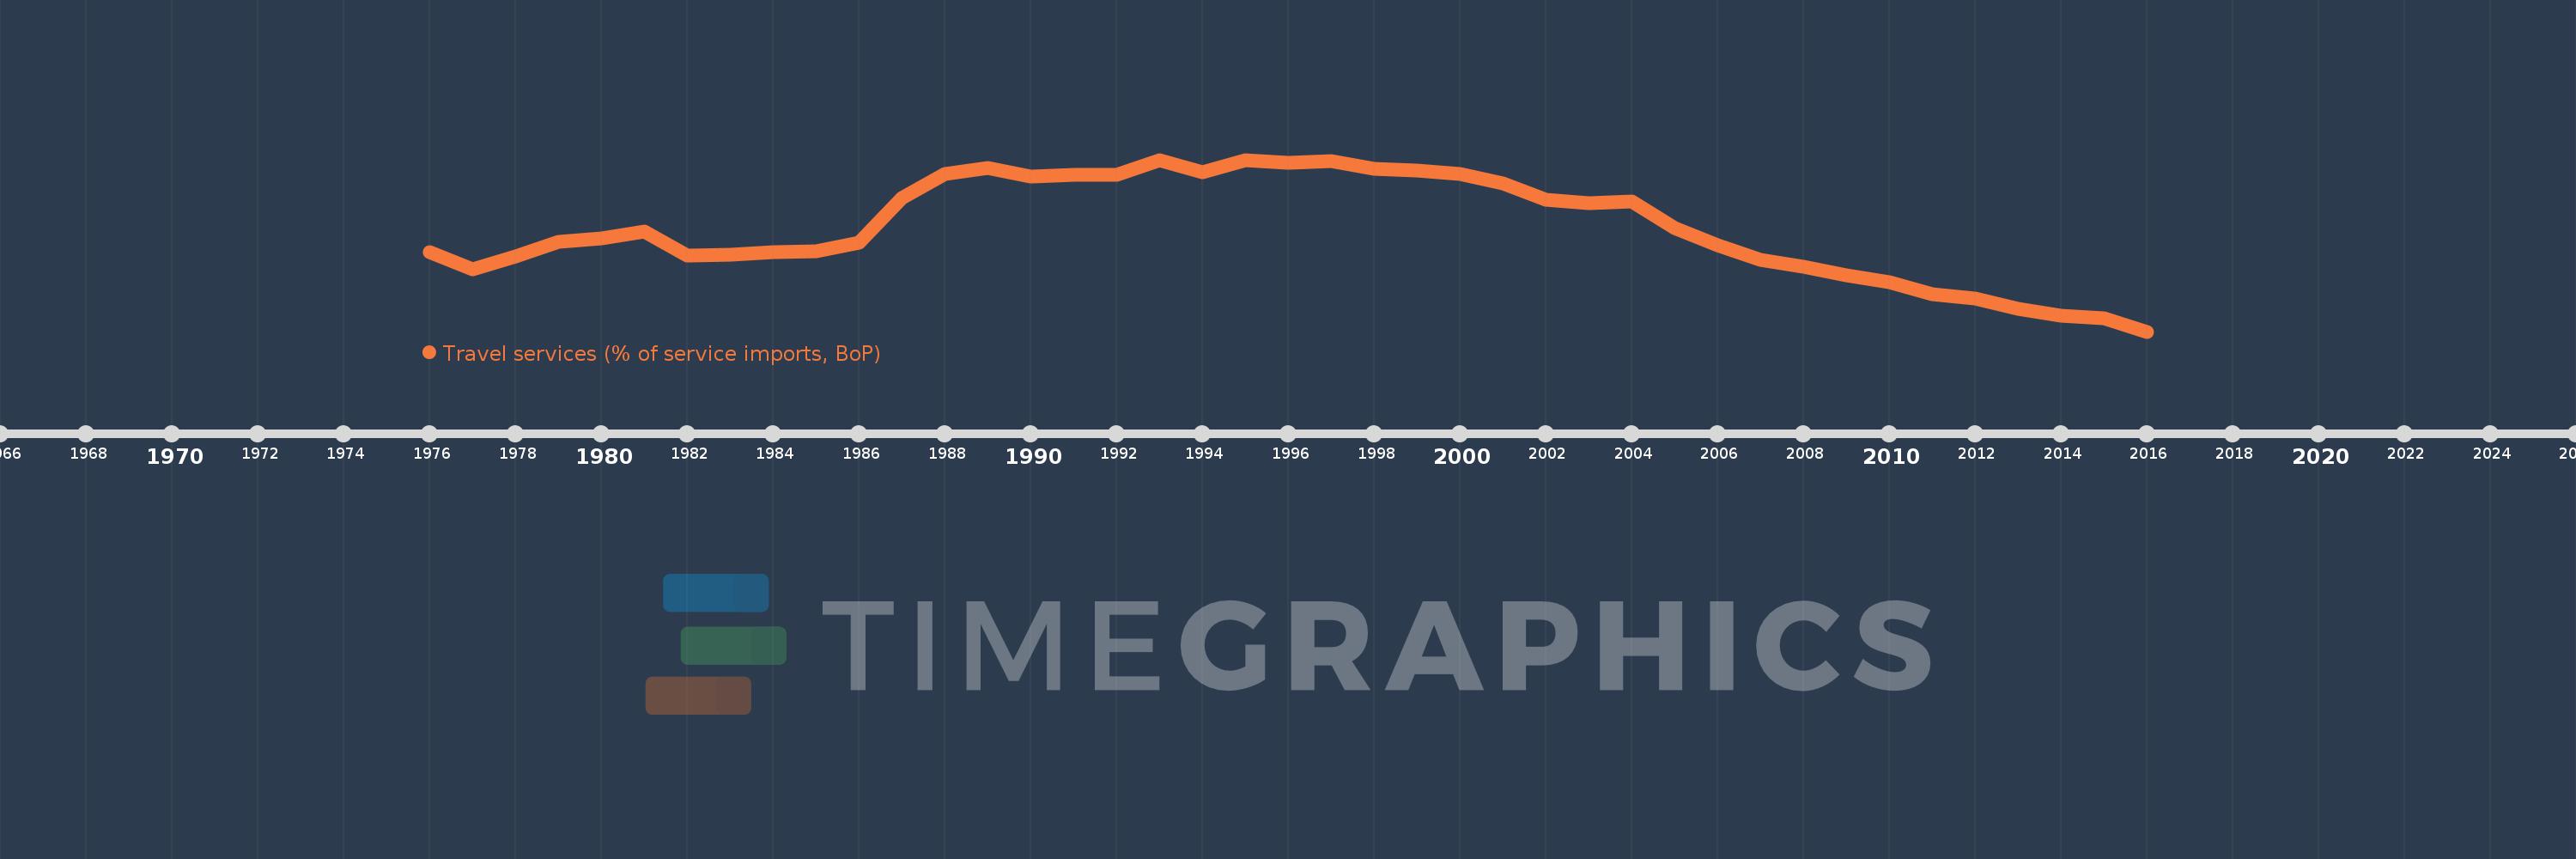
Travel services (% of service imports, BoP)
2016,2015,2014,2013,2012,2011,2010,2009,2008,2007,2006,2005,2004,2003,2002,2001,2000,1999,1998,1997,1996,1995,1994,1993,1992,1991,1990,1989,1988,1987,1986,1985,1984,1983,1982,1981,1980,1979,1978,1977,1976
This statistics in other country:
AfghanistanAlbaniaAlgeriaAngolaAntigua and BarbudaArab WorldArgentinaArmeniaArubaAustraliaAustriaAzerbaijanBahamas, TheBahrainBangladeshBarbadosBelarusBelgiumBelizeBeninBermudaBhutanBoliviaBosnia and HerzegovinaBotswanaBrazilBrunei DarussalamBulgariaBurkina FasoBurundiCabo VerdeCambodiaCameroonCanadaCaribbean small statesCentral African RepublicCentral Europe and the BalticsChadChileChinaColombiaComorosCongo, Dem. Rep.Congo, Rep.Costa RicaCote d'IvoireCroatiaCuracaoCyprusCzech RepublicDenmarkDjiboutiDominicaDominican RepublicEarly-demographic dividendEast Asia & PacificEast Asia & Pacific (excluding high income)East Asia & Pacific (IDA & IBRD countries)EcuadorEgypt, Arab Rep.El SalvadorEritreaEstoniaEthiopiaEuro areaEurope & Central AsiaEurope & Central Asia (excluding high income)Europe & Central Asia (IDA & IBRD countries)European UnionFaroe IslandsFijiFinlandFragile and conflict affected situationsFranceFrench PolynesiaGabonGambia, TheGeorgiaGermanyGhanaGreeceGrenadaGuatemalaGuineaGuinea-BissauGuyanaHaitiHeavily indebted poor countries (HIPC)High incomeHondurasHong Kong SAR, ChinaHungaryIBRD onlyIcelandIDA & IBRD totalIDA onlyIDA totalIndiaIndonesiaIran, Islamic Rep.IraqIrelandIsraelItalyJamaicaJapanJordanKazakhstanKenyaKiribatiKorea, Rep.KosovoKuwaitKyrgyz RepublicLao PDRLate-demographic dividendLatin America & Caribbean Latin America & Caribbean (excluding high income)Latin America & the Caribbean (IDA & IBRD countries)LatviaLeast developed countries: UN classificationLebanonLesothoLiberiaLibyaLithuaniaLow & middle incomeLow incomeLower middle incomeLuxembourgMacao SAR, ChinaMacedonia, FYRMadagascarMalawiMalaysiaMaldivesMaliMaltaMarshall IslandsMauritaniaMauritiusMexicoMicronesia, Fed. Sts.Middle East & North AfricaMiddle East & North Africa (excluding high income)Middle East & North Africa (IDA & IBRD countries)Middle incomeMoldovaMongoliaMontenegroMoroccoMozambiqueMyanmarNamibiaNepalNetherlandsNew CaledoniaNew ZealandNicaraguaNigerNigeriaNorth AmericaNorwayOECD membersOmanOther small statesPacific island small statesPakistanPalauPanamaPapua New GuineaParaguayPeruPhilippinesPolandPortugalPost-demographic dividendPre-demographic dividendQatarRomaniaRussian FederationRwandaSamoaSao Tome and PrincipeSaudi ArabiaSenegalSerbiaSeychellesSierra LeoneSingaporeSint Maarten (Dutch part)Slovak RepublicSloveniaSmall statesSolomon IslandsSouth AfricaSouth AsiaSouth Asia (IDA & IBRD)South SudanSpainSri LankaSt. Kitts and NevisSt. LuciaSt. Vincent and the GrenadinesSub-Saharan Africa Sub-Saharan Africa (excluding high income)Sub-Saharan Africa (IDA & IBRD countries)SudanSurinameSwazilandSwedenSwitzerlandSyrian Arab RepublicTajikistanTanzaniaThailandTimor-LesteTogoTongaTrinidad and TobagoTunisiaTurkeyTuvaluUgandaUkraineUnited KingdomUnited StatesUpper middle incomeUruguayVanuatuVenezuela, RBWest Bank and GazaWorldYemen, Rep.ZambiaZimbabwe Timeline:
This timeline shows a graph from 1976 to 2016 of European Union. No data until 1975. Number of actual observations by date: 41.
Source name:
World Development Indicators
Source organization:
International Monetary Fund, Balance of Payments Statistics Yearbook and data files.
Categories, topics:
Economy & Growth, Trade
Last updated:
apr 23, 2017
Indicators value changes by year
Minimum:
19.356
jan 1, 2016
Maximum:
33.146
jan 1, 1995
At the date of observation
Value
Absolute change
Change from previous value
jan 1, 1976
25.744
+25.744
0.0%
jan 1, 1977
24.354
-1.39
-5.4%
jan 1, 1978
25.416
+1.062
4.36%
jan 1, 1979
26.569
+1.153
4.54%
jan 1, 1980
26.822
+0.253
0.95%
jan 1, 1981
27.373
+0.551
2.05%
jan 1, 1982
25.469
-1.904
-6.96%
jan 1, 1983
25.553
+0.084
0.33%
jan 1, 1984
25.767
+0.214
0.84%
jan 1, 1985
25.788
+0.021
0.08%
jan 1, 1986
26.465
+0.677
2.63%
jan 1, 1987
30.052
+3.587
13.55%
jan 1, 1988
32.017
+1.966
6.54%
jan 1, 1989
32.517
+0.5
1.56%
jan 1, 1990
31.769
-0.749
-2.3%
jan 1, 1991
31.967
+0.198
0.62%
jan 1, 1992
31.963
-0.004
-0.01%
jan 1, 1993
33.134
+1.171
3.66%
jan 1, 1994
32.178
-0.956
-2.88%
jan 1, 1995
33.146
+0.968
3.01%
jan 1, 1996
32.904
-0.242
-0.73%
jan 1, 1997
33.03
+0.126
0.38%
jan 1, 1998
32.412
-0.618
-1.87%
jan 1, 1999
32.314
-0.097
-0.3%
jan 1, 2000
32.009
-0.305
-0.94%
jan 1, 2001
31.216
-0.793
-2.48%
jan 1, 2002
29.928
-1.288
-4.13%
jan 1, 2003
29.675
-0.252
-0.84%
jan 1, 2004
29.773
+0.097
0.33%
jan 1, 2005
27.678
-2.095
-7.04%
jan 1, 2006
26.286
-1.392
-5.03%
jan 1, 2007
25.117
-1.169
-4.45%
jan 1, 2008
24.593
-0.524
-2.09%
jan 1, 2009
23.865
-0.728
-2.96%
jan 1, 2010
23.309
-0.555
-2.33%
jan 1, 2011
22.322
-0.987
-4.23%
jan 1, 2012
21.978
-0.344
-1.54%
jan 1, 2013
21.194
-0.785
-3.57%
jan 1, 2014
20.65
-0.544
-2.57%
jan 1, 2015
20.431
-0.218
-1.06%
jan 1, 2016
19.356
-1.075
-5.26%
Ranking of countries by current statistics by years


Comments: