29
/
en
AIzaSyAYiBZKx7MnpbEhh9jyipgxe19OcubqV5w
April 1, 2024
270180
Turkey
TUR
true
2
1
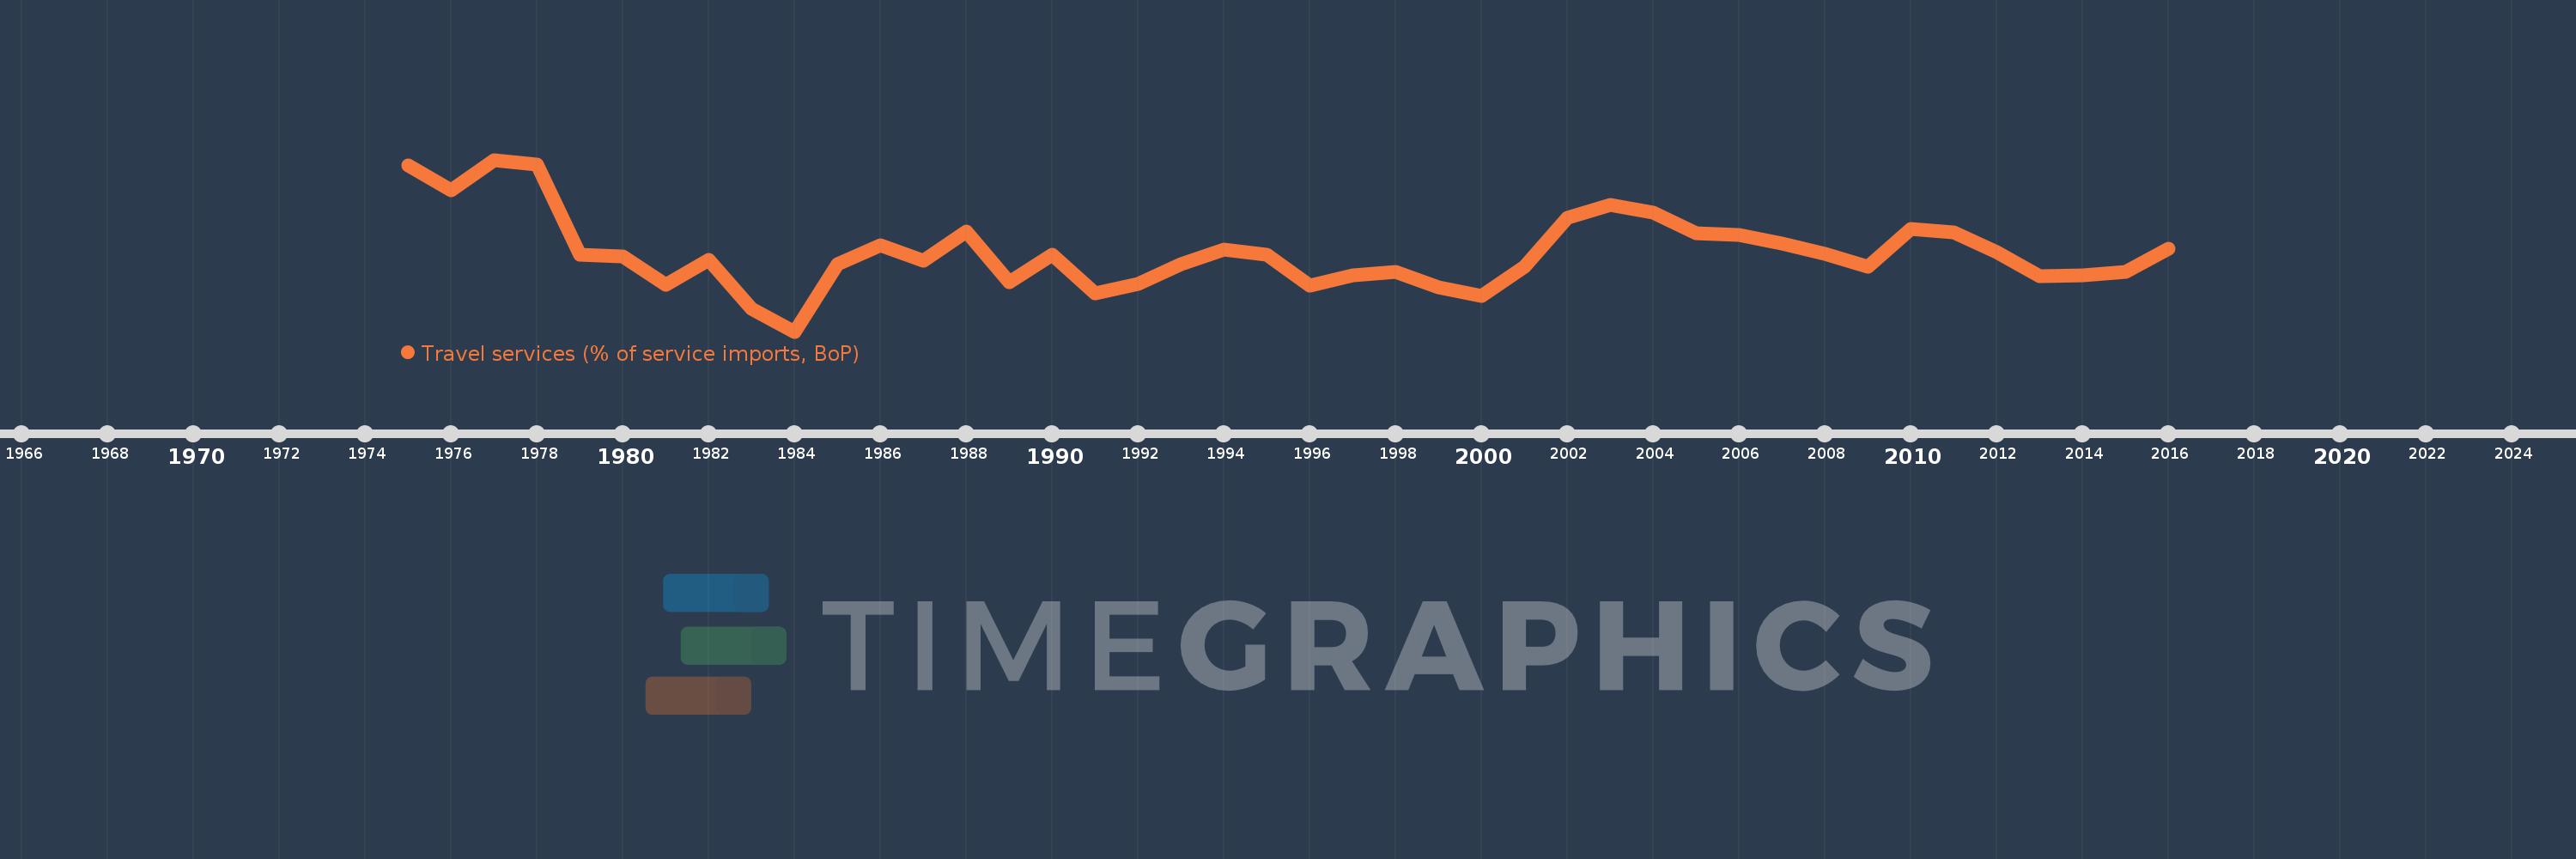
Travel services (% of service imports, BoP)
2016,2015,2014,2013,2012,2011,2010,2009,2008,2007,2006,2005,2004,2003,2002,2001,2000,1999,1998,1997,1996,1995,1994,1993,1992,1991,1990,1989,1988,1987,1986,1985,1984,1983,1982,1981,1980,1979,1978,1977,1976,1975
This statistics in other country:
AfghanistanAlbaniaAlgeriaAngolaAntigua and BarbudaArab WorldArgentinaArmeniaArubaAustraliaAustriaAzerbaijanBahamas, TheBahrainBangladeshBarbadosBelarusBelgiumBelizeBeninBermudaBhutanBoliviaBosnia and HerzegovinaBotswanaBrazilBrunei DarussalamBulgariaBurkina FasoBurundiCabo VerdeCambodiaCameroonCanadaCaribbean small statesCentral African RepublicCentral Europe and the BalticsChadChileChinaColombiaComorosCongo, Dem. Rep.Congo, Rep.Costa RicaCote d'IvoireCroatiaCuracaoCyprusCzech RepublicDenmarkDjiboutiDominicaDominican RepublicEarly-demographic dividendEast Asia & PacificEast Asia & Pacific (excluding high income)East Asia & Pacific (IDA & IBRD countries)EcuadorEgypt, Arab Rep.El SalvadorEritreaEstoniaEthiopiaEuro areaEurope & Central AsiaEurope & Central Asia (excluding high income)Europe & Central Asia (IDA & IBRD countries)European UnionFaroe IslandsFijiFinlandFragile and conflict affected situationsFranceFrench PolynesiaGabonGambia, TheGeorgiaGermanyGhanaGreeceGrenadaGuatemalaGuineaGuinea-BissauGuyanaHaitiHeavily indebted poor countries (HIPC)High incomeHondurasHong Kong SAR, ChinaHungaryIBRD onlyIcelandIDA & IBRD totalIDA onlyIDA totalIndiaIndonesiaIran, Islamic Rep.IraqIrelandIsraelItalyJamaicaJapanJordanKazakhstanKenyaKiribatiKorea, Rep.KosovoKuwaitKyrgyz RepublicLao PDRLate-demographic dividendLatin America & Caribbean Latin America & Caribbean (excluding high income)Latin America & the Caribbean (IDA & IBRD countries)LatviaLeast developed countries: UN classificationLebanonLesothoLiberiaLibyaLithuaniaLow & middle incomeLow incomeLower middle incomeLuxembourgMacao SAR, ChinaMacedonia, FYRMadagascarMalawiMalaysiaMaldivesMaliMaltaMarshall IslandsMauritaniaMauritiusMexicoMicronesia, Fed. Sts.Middle East & North AfricaMiddle East & North Africa (excluding high income)Middle East & North Africa (IDA & IBRD countries)Middle incomeMoldovaMongoliaMontenegroMoroccoMozambiqueMyanmarNamibiaNepalNetherlandsNew CaledoniaNew ZealandNicaraguaNigerNigeriaNorth AmericaNorwayOECD membersOmanOther small statesPacific island small statesPakistanPalauPanamaPapua New GuineaParaguayPeruPhilippinesPolandPortugalPost-demographic dividendPre-demographic dividendQatarRomaniaRussian FederationRwandaSamoaSao Tome and PrincipeSaudi ArabiaSenegalSerbiaSeychellesSierra LeoneSingaporeSint Maarten (Dutch part)Slovak RepublicSloveniaSmall statesSolomon IslandsSouth AfricaSouth AsiaSouth Asia (IDA & IBRD)South SudanSpainSri LankaSt. Kitts and NevisSt. LuciaSt. Vincent and the GrenadinesSub-Saharan Africa Sub-Saharan Africa (excluding high income)Sub-Saharan Africa (IDA & IBRD countries)SudanSurinameSwazilandSwedenSwitzerlandSyrian Arab RepublicTajikistanTanzaniaThailandTimor-LesteTogoTongaTrinidad and TobagoTunisiaTurkeyTuvaluUgandaUkraineUnited KingdomUnited StatesUpper middle incomeUruguayVanuatuVenezuela, RBWest Bank and GazaWorldYemen, Rep.ZambiaZimbabwe Timeline:
This timeline shows a graph from 1975 to 2016 of Turkey. No data until 1974. Number of actual observations by date: 42.
Source name:
World Development Indicators
Source organization:
International Monetary Fund, Balance of Payments Statistics Yearbook and data files.
Categories, topics:
Economy & Growth, Trade
Last updated:
apr 23, 2017
Indicators value changes by year
Minimum:
10.978
jan 1, 1984
Maximum:
37.524
jan 1, 1977
At the date of observation
Value
Absolute change
Change from previous value
jan 1, 1975
36.612
+36.612
0.0%
jan 1, 1976
32.798
-3.814
-10.42%
jan 1, 1977
37.524
+4.726
14.41%
jan 1, 1978
36.827
-0.697
-1.86%
jan 1, 1979
22.903
-13.924
-37.81%
jan 1, 1980
22.616
-0.287
-1.25%
jan 1, 1981
18.278
-4.338
-19.18%
jan 1, 1982
22.009
+3.731
20.41%
jan 1, 1983
14.452
-7.557
-34.33%
jan 1, 1984
10.978
-3.474
-24.04%
jan 1, 1985
21.373
+10.396
94.7%
jan 1, 1986
24.306
+2.933
13.72%
jan 1, 1987
21.919
-2.387
-9.82%
jan 1, 1988
26.431
+4.512
20.58%
jan 1, 1989
18.597
-7.833
-29.64%
jan 1, 1990
22.921
+4.323
23.25%
jan 1, 1991
16.933
-5.988
-26.13%
jan 1, 1992
18.397
+1.464
8.65%
jan 1, 1993
21.407
+3.01
16.36%
jan 1, 1994
23.658
+2.251
10.51%
jan 1, 1995
22.898
-0.76
-3.21%
jan 1, 1996
18.133
-4.765
-20.81%
jan 1, 1997
19.686
+1.553
8.56%
jan 1, 1998
20.174
+0.488
2.48%
jan 1, 1999
17.793
-2.381
-11.8%
jan 1, 2000
16.438
-1.355
-7.62%
jan 1, 2001
21.011
+4.573
27.82%
jan 1, 2002
28.501
+7.49
35.65%
jan 1, 2003
30.589
+2.088
7.33%
jan 1, 2004
29.426
-1.163
-3.8%
jan 1, 2005
26.215
-3.212
-10.91%
jan 1, 2006
25.975
-0.24
-0.91%
jan 1, 2007
24.52
-1.455
-5.6%
jan 1, 2008
22.928
-1.592
-6.49%
jan 1, 2009
21.01
-1.918
-8.37%
jan 1, 2010
26.775
+5.765
27.44%
jan 1, 2011
26.36
-0.415
-1.55%
jan 1, 2012
23.286
-3.074
-11.66%
jan 1, 2013
19.515
-3.771
-16.19%
jan 1, 2014
19.647
+0.132
0.68%
jan 1, 2015
20.217
+0.57
2.9%
jan 1, 2016
23.792
+3.575
17.69%
Ranking of countries by current statistics by years


Comments: