29
/
en
AIzaSyAYiBZKx7MnpbEhh9jyipgxe19OcubqV5w
April 1, 2024
165661
Jordan
JOR
true
2
1
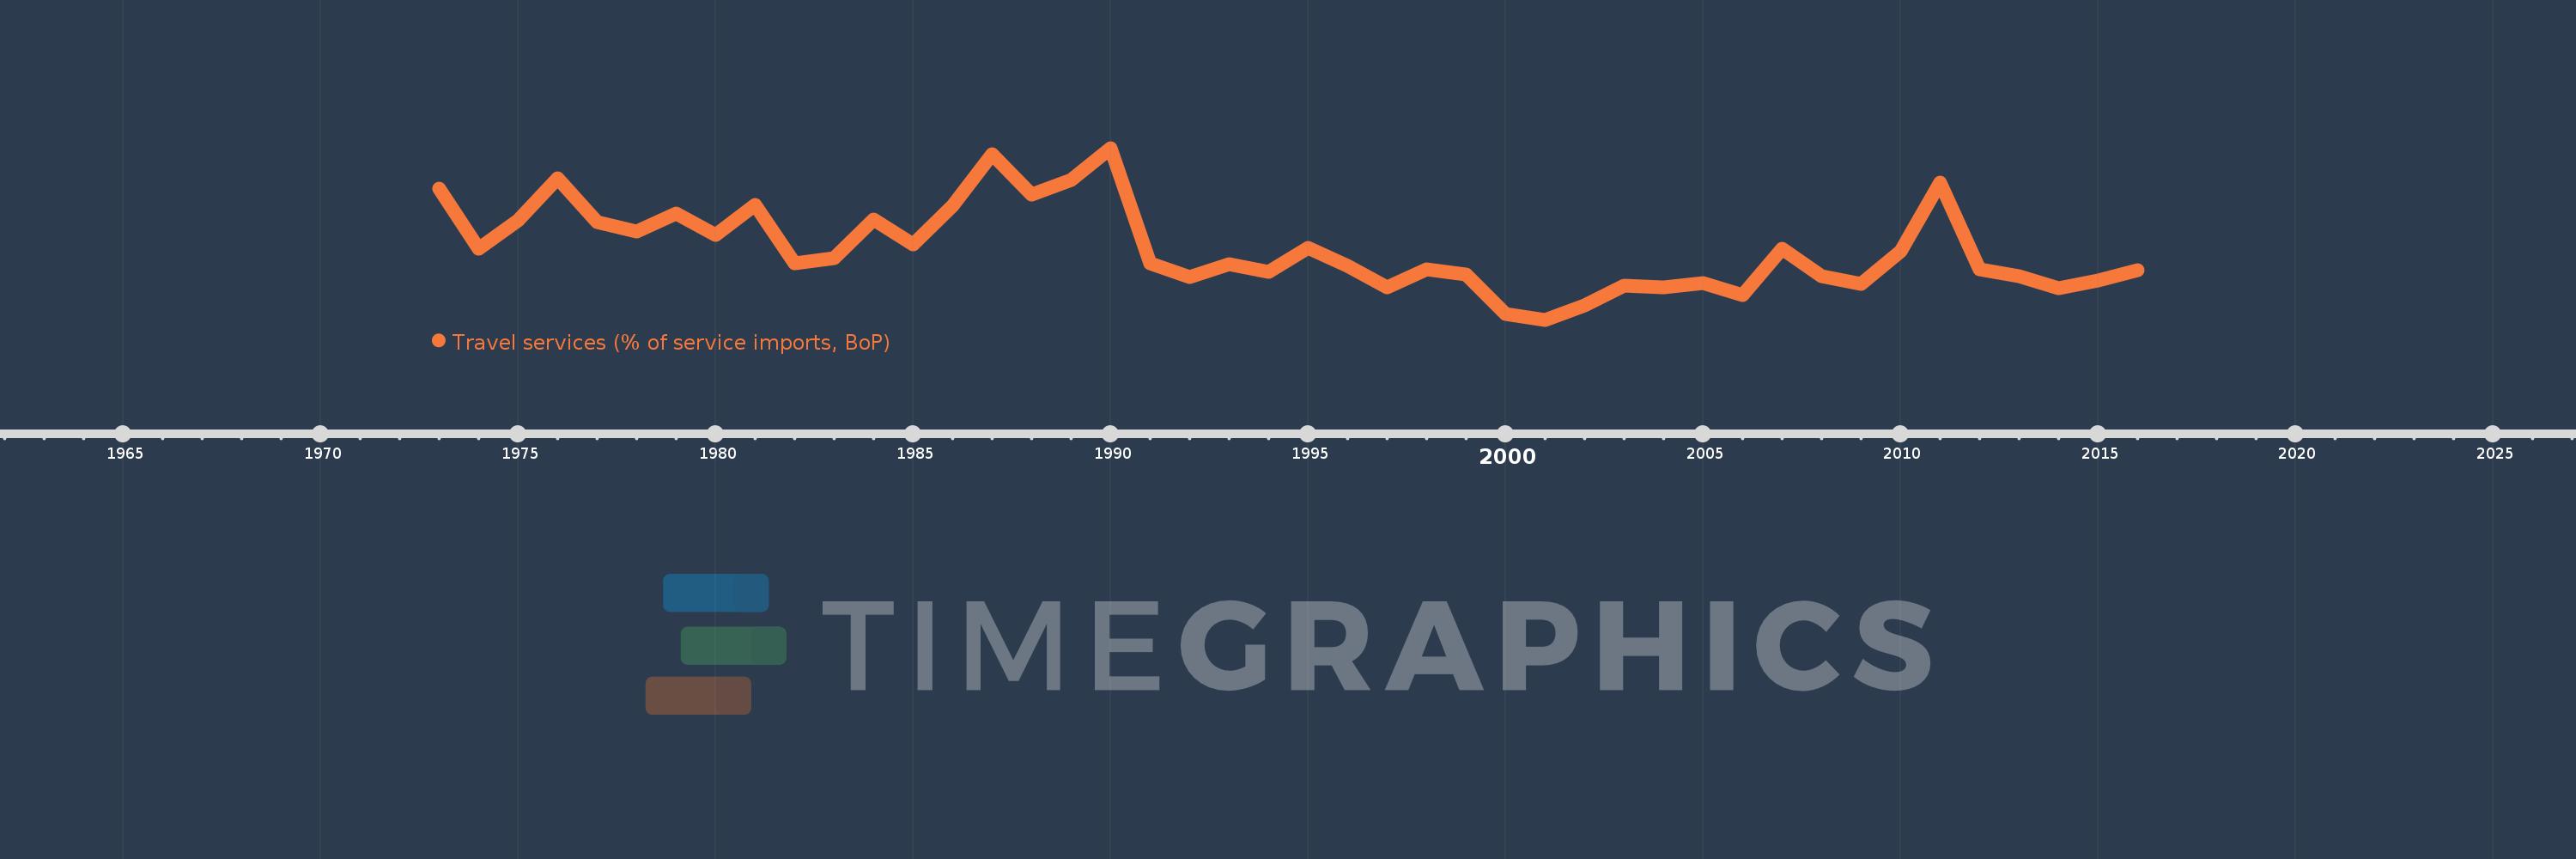
Travel services (% of service imports, BoP)
2016,2015,2014,2013,2012,2011,2010,2009,2008,2007,2006,2005,2004,2003,2002,2001,2000,1999,1998,1997,1996,1995,1994,1993,1992,1991,1990,1989,1988,1987,1986,1985,1984,1983,1982,1981,1980,1979,1978,1977,1976,1975,1974,1973
This statistics in other country:
AfghanistanAlbaniaAlgeriaAngolaAntigua and BarbudaArab WorldArgentinaArmeniaArubaAustraliaAustriaAzerbaijanBahamas, TheBahrainBangladeshBarbadosBelarusBelgiumBelizeBeninBermudaBhutanBoliviaBosnia and HerzegovinaBotswanaBrazilBrunei DarussalamBulgariaBurkina FasoBurundiCabo VerdeCambodiaCameroonCanadaCaribbean small statesCentral African RepublicCentral Europe and the BalticsChadChileChinaColombiaComorosCongo, Dem. Rep.Congo, Rep.Costa RicaCote d'IvoireCroatiaCuracaoCyprusCzech RepublicDenmarkDjiboutiDominicaDominican RepublicEarly-demographic dividendEast Asia & PacificEast Asia & Pacific (excluding high income)East Asia & Pacific (IDA & IBRD countries)EcuadorEgypt, Arab Rep.El SalvadorEritreaEstoniaEthiopiaEuro areaEurope & Central AsiaEurope & Central Asia (excluding high income)Europe & Central Asia (IDA & IBRD countries)European UnionFaroe IslandsFijiFinlandFragile and conflict affected situationsFranceFrench PolynesiaGabonGambia, TheGeorgiaGermanyGhanaGreeceGrenadaGuatemalaGuineaGuinea-BissauGuyanaHaitiHeavily indebted poor countries (HIPC)High incomeHondurasHong Kong SAR, ChinaHungaryIBRD onlyIcelandIDA & IBRD totalIDA onlyIDA totalIndiaIndonesiaIran, Islamic Rep.IraqIrelandIsraelItalyJamaicaJapanJordanKazakhstanKenyaKiribatiKorea, Rep.KosovoKuwaitKyrgyz RepublicLao PDRLate-demographic dividendLatin America & Caribbean Latin America & Caribbean (excluding high income)Latin America & the Caribbean (IDA & IBRD countries)LatviaLeast developed countries: UN classificationLebanonLesothoLiberiaLibyaLithuaniaLow & middle incomeLow incomeLower middle incomeLuxembourgMacao SAR, ChinaMacedonia, FYRMadagascarMalawiMalaysiaMaldivesMaliMaltaMarshall IslandsMauritaniaMauritiusMexicoMicronesia, Fed. Sts.Middle East & North AfricaMiddle East & North Africa (excluding high income)Middle East & North Africa (IDA & IBRD countries)Middle incomeMoldovaMongoliaMontenegroMoroccoMozambiqueMyanmarNamibiaNepalNetherlandsNew CaledoniaNew ZealandNicaraguaNigerNigeriaNorth AmericaNorwayOECD membersOmanOther small statesPacific island small statesPakistanPalauPanamaPapua New GuineaParaguayPeruPhilippinesPolandPortugalPost-demographic dividendPre-demographic dividendQatarRomaniaRussian FederationRwandaSamoaSao Tome and PrincipeSaudi ArabiaSenegalSerbiaSeychellesSierra LeoneSingaporeSint Maarten (Dutch part)Slovak RepublicSloveniaSmall statesSolomon IslandsSouth AfricaSouth AsiaSouth Asia (IDA & IBRD)South SudanSpainSri LankaSt. Kitts and NevisSt. LuciaSt. Vincent and the GrenadinesSub-Saharan Africa Sub-Saharan Africa (excluding high income)Sub-Saharan Africa (IDA & IBRD countries)SudanSurinameSwazilandSwedenSwitzerlandSyrian Arab RepublicTajikistanTanzaniaThailandTimor-LesteTogoTongaTrinidad and TobagoTunisiaTurkeyTuvaluUgandaUkraineUnited KingdomUnited StatesUpper middle incomeUruguayVanuatuVenezuela, RBWest Bank and GazaWorldYemen, Rep.ZambiaZimbabwe Timeline:
This timeline shows a graph from 1973 to 2016 of Jordan. No data until 1972. Number of actual observations by date: 44.
Source name:
World Development Indicators
Source organization:
International Monetary Fund, Balance of Payments Statistics Yearbook and data files.
Categories, topics:
Economy & Growth, Trade
Last updated:
apr 23, 2017
Indicators value changes by year
Minimum:
20.305
jan 1, 2001
Maximum:
39.365
jan 1, 1990
At the date of observation
Value
Absolute change
Change from previous value
jan 1, 1973
34.877
+34.877
0.0%
jan 1, 1974
28.18
-6.697
-19.2%
jan 1, 1975
31.351
+3.172
11.26%
jan 1, 1976
36.034
+4.683
14.94%
jan 1, 1977
31.182
-4.852
-13.47%
jan 1, 1978
30.092
-1.09
-3.5%
jan 1, 1979
32.105
+2.013
6.69%
jan 1, 1980
29.701
-2.404
-7.49%
jan 1, 1981
33.091
+3.39
11.41%
jan 1, 1982
26.583
-6.508
-19.67%
jan 1, 1983
27.093
+0.51
1.92%
jan 1, 1984
31.465
+4.372
16.14%
jan 1, 1985
28.621
-2.844
-9.04%
jan 1, 1986
32.951
+4.33
15.13%
jan 1, 1987
38.663
+5.712
17.33%
jan 1, 1988
34.219
-4.444
-11.49%
jan 1, 1989
35.838
+1.619
4.73%
jan 1, 1990
39.365
+3.526
9.84%
jan 1, 1991
26.526
-12.839
-32.62%
jan 1, 1992
25.062
-1.464
-5.52%
jan 1, 1993
26.462
+1.4
5.59%
jan 1, 1994
25.62
-0.841
-3.18%
jan 1, 1995
28.298
+2.678
10.45%
jan 1, 1996
26.293
-2.004
-7.08%
jan 1, 1997
23.87
-2.423
-9.22%
jan 1, 1998
25.892
+2.022
8.47%
jan 1, 1999
25.287
-0.606
-2.34%
jan 1, 2000
20.924
-4.363
-17.25%
jan 1, 2001
20.305
-0.619
-2.96%
jan 1, 2002
21.878
+1.573
7.75%
jan 1, 2003
24.067
+2.189
10.01%
jan 1, 2004
23.919
-0.148
-0.62%
jan 1, 2005
24.412
+0.492
2.06%
jan 1, 2006
23.021
-1.391
-5.7%
jan 1, 2007
28.174
+5.153
22.39%
jan 1, 2008
25.094
-3.08
-10.93%
jan 1, 2009
24.321
-0.774
-3.08%
jan 1, 2010
27.869
+3.549
14.59%
jan 1, 2011
35.563
+7.694
27.61%
jan 1, 2012
25.932
-9.632
-27.08%
jan 1, 2013
25.163
-0.768
-2.96%
jan 1, 2014
23.771
-1.393
-5.53%
jan 1, 2015
24.64
+0.869
3.66%
jan 1, 2016
25.792
+1.152
4.68%
Ranking of countries by current statistics by years


Comments: