29
/
en
AIzaSyAYiBZKx7MnpbEhh9jyipgxe19OcubqV5w
April 1, 2024
101683
Canada
CAN
true
2
1
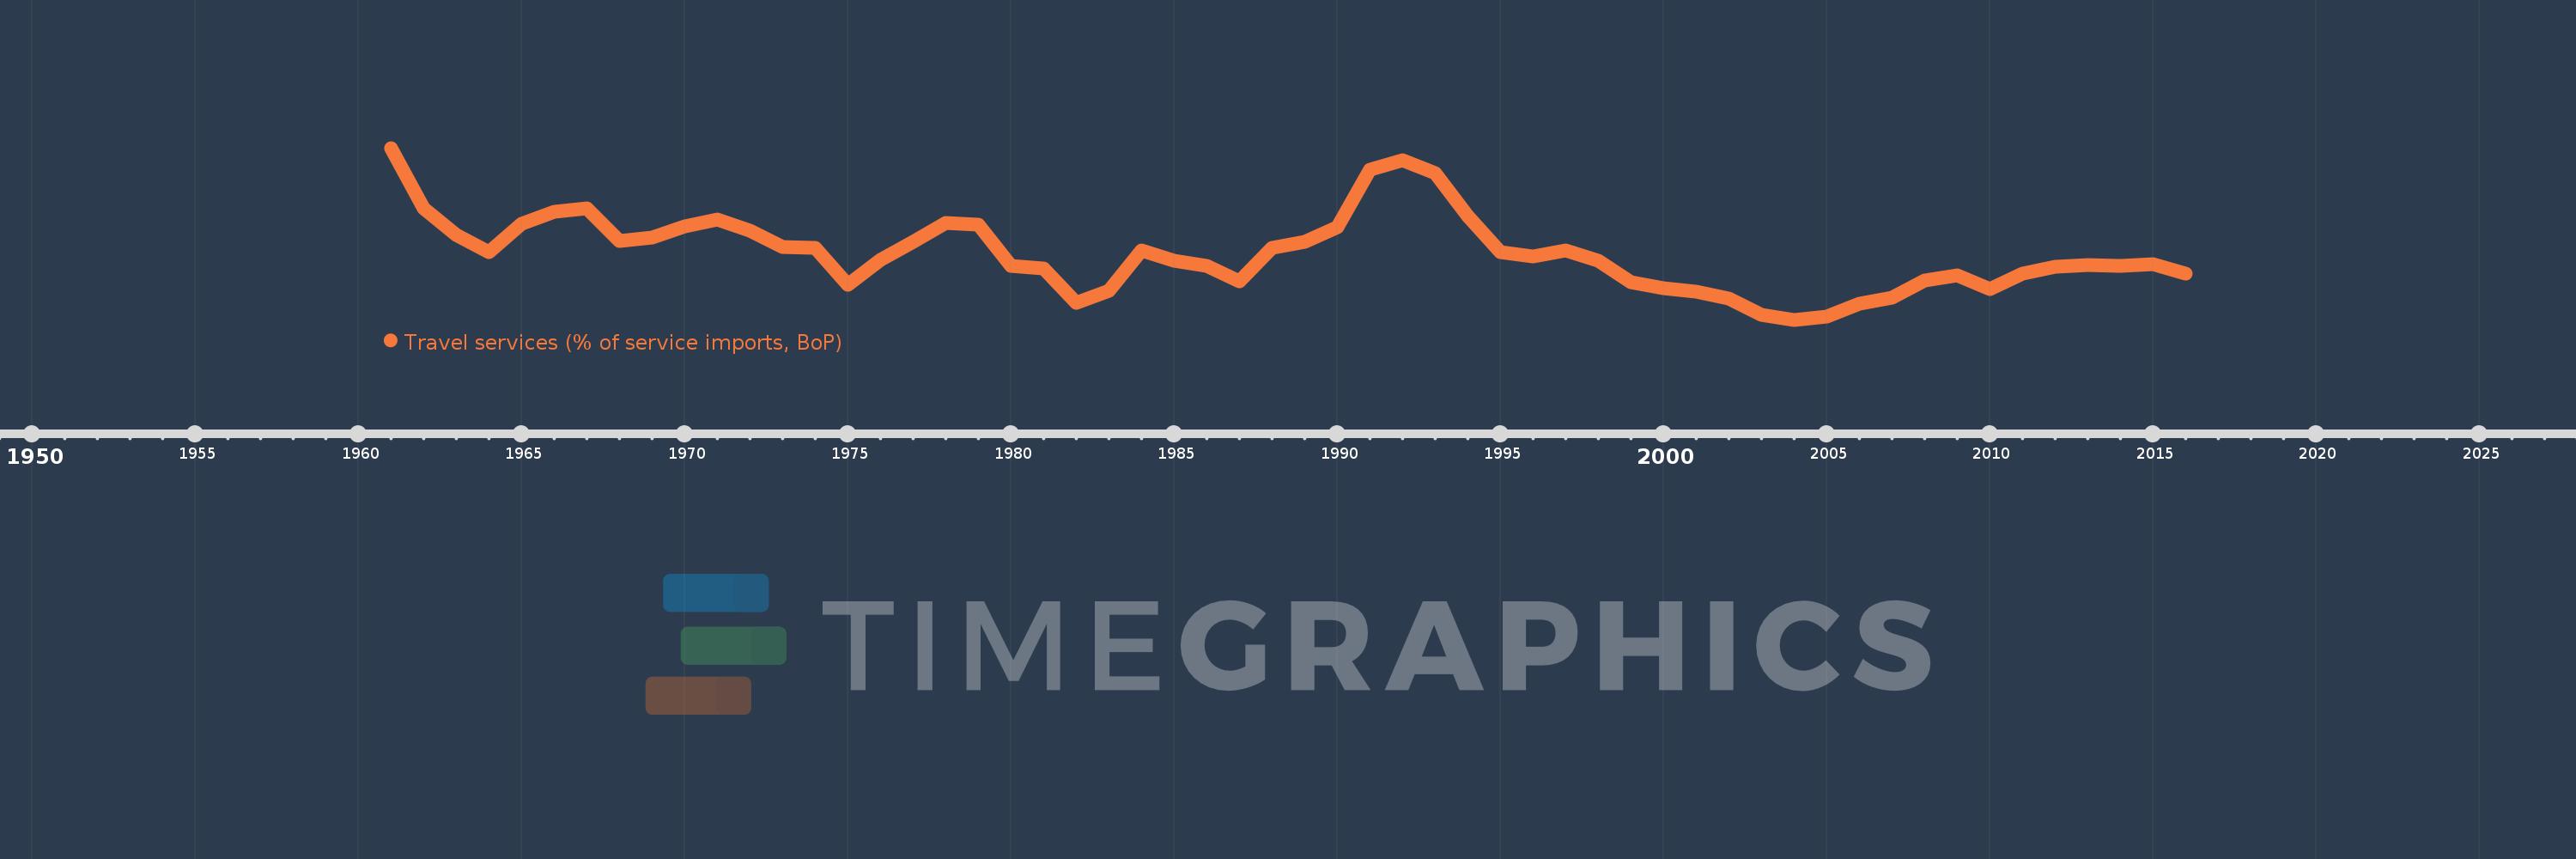
Travel services (% of service imports, BoP)
2016,2015,2014,2013,2012,2011,2010,2009,2008,2007,2006,2005,2004,2003,2002,2001,2000,1999,1998,1997,1996,1995,1994,1993,1992,1991,1990,1989,1988,1987,1986,1985,1984,1983,1982,1981,1980,1979,1978,1977,1976,1975,1974,1973,1972,1971,1970,1969,1968,1967,1966,1965,1964,1963,1962,1961
This statistics in other country:
AfghanistanAlbaniaAlgeriaAngolaAntigua and BarbudaArab WorldArgentinaArmeniaArubaAustraliaAustriaAzerbaijanBahamas, TheBahrainBangladeshBarbadosBelarusBelgiumBelizeBeninBermudaBhutanBoliviaBosnia and HerzegovinaBotswanaBrazilBrunei DarussalamBulgariaBurkina FasoBurundiCabo VerdeCambodiaCameroonCanadaCaribbean small statesCentral African RepublicCentral Europe and the BalticsChadChileChinaColombiaComorosCongo, Dem. Rep.Congo, Rep.Costa RicaCote d'IvoireCroatiaCuracaoCyprusCzech RepublicDenmarkDjiboutiDominicaDominican RepublicEarly-demographic dividendEast Asia & PacificEast Asia & Pacific (excluding high income)East Asia & Pacific (IDA & IBRD countries)EcuadorEgypt, Arab Rep.El SalvadorEritreaEstoniaEthiopiaEuro areaEurope & Central AsiaEurope & Central Asia (excluding high income)Europe & Central Asia (IDA & IBRD countries)European UnionFaroe IslandsFijiFinlandFragile and conflict affected situationsFranceFrench PolynesiaGabonGambia, TheGeorgiaGermanyGhanaGreeceGrenadaGuatemalaGuineaGuinea-BissauGuyanaHaitiHeavily indebted poor countries (HIPC)High incomeHondurasHong Kong SAR, ChinaHungaryIBRD onlyIcelandIDA & IBRD totalIDA onlyIDA totalIndiaIndonesiaIran, Islamic Rep.IraqIrelandIsraelItalyJamaicaJapanJordanKazakhstanKenyaKiribatiKorea, Rep.KosovoKuwaitKyrgyz RepublicLao PDRLate-demographic dividendLatin America & Caribbean Latin America & Caribbean (excluding high income)Latin America & the Caribbean (IDA & IBRD countries)LatviaLeast developed countries: UN classificationLebanonLesothoLiberiaLibyaLithuaniaLow & middle incomeLow incomeLower middle incomeLuxembourgMacao SAR, ChinaMacedonia, FYRMadagascarMalawiMalaysiaMaldivesMaliMaltaMarshall IslandsMauritaniaMauritiusMexicoMicronesia, Fed. Sts.Middle East & North AfricaMiddle East & North Africa (excluding high income)Middle East & North Africa (IDA & IBRD countries)Middle incomeMoldovaMongoliaMontenegroMoroccoMozambiqueMyanmarNamibiaNepalNetherlandsNew CaledoniaNew ZealandNicaraguaNigerNigeriaNorth AmericaNorwayOECD membersOmanOther small statesPacific island small statesPakistanPalauPanamaPapua New GuineaParaguayPeruPhilippinesPolandPortugalPost-demographic dividendPre-demographic dividendQatarRomaniaRussian FederationRwandaSamoaSao Tome and PrincipeSaudi ArabiaSenegalSerbiaSeychellesSierra LeoneSingaporeSint Maarten (Dutch part)Slovak RepublicSloveniaSmall statesSolomon IslandsSouth AfricaSouth AsiaSouth Asia (IDA & IBRD)South SudanSpainSri LankaSt. Kitts and NevisSt. LuciaSt. Vincent and the GrenadinesSub-Saharan Africa Sub-Saharan Africa (excluding high income)Sub-Saharan Africa (IDA & IBRD countries)SudanSurinameSwazilandSwedenSwitzerlandSyrian Arab RepublicTajikistanTanzaniaThailandTimor-LesteTogoTongaTrinidad and TobagoTunisiaTurkeyTuvaluUgandaUkraineUnited KingdomUnited StatesUpper middle incomeUruguayVanuatuVenezuela, RBWest Bank and GazaWorldYemen, Rep.ZambiaZimbabwe Timeline:
This timeline shows a graph from 1961 to 2016 of Canada. No data until 1960. Number of actual observations by date: 56.
Source name:
World Development Indicators
Source organization:
International Monetary Fund, Balance of Payments Statistics Yearbook and data files.
Categories, topics:
Economy & Growth, Trade
Last updated:
apr 23, 2017
Indicators value changes by year
Minimum:
26.157
jan 1, 2004
Maximum:
42.236
jan 1, 1961
At the date of observation
Value
Absolute change
Change from previous value
jan 1, 1961
42.236
+42.236
0.0%
jan 1, 1962
36.609
-5.627
-13.32%
jan 1, 1963
34.13
-2.479
-6.77%
jan 1, 1964
32.463
-1.667
-4.88%
jan 1, 1965
35.171
+2.708
8.34%
jan 1, 1966
36.281
+1.11
3.16%
jan 1, 1967
36.607
+0.326
0.9%
jan 1, 1968
33.523
-3.084
-8.43%
jan 1, 1969
33.826
+0.304
0.91%
jan 1, 1970
34.879
+1.053
3.11%
jan 1, 1971
35.504
+0.624
1.79%
jan 1, 1972
34.458
-1.046
-2.94%
jan 1, 1973
32.946
-1.512
-4.39%
jan 1, 1974
32.86
-0.086
-0.26%
jan 1, 1975
29.467
-3.393
-10.33%
jan 1, 1976
31.774
+2.308
7.83%
jan 1, 1977
33.477
+1.703
5.36%
jan 1, 1978
35.255
+1.777
5.31%
jan 1, 1979
35.084
-0.171
-0.49%
jan 1, 1980
31.174
-3.91
-11.14%
jan 1, 1981
30.918
-0.255
-0.82%
jan 1, 1982
27.769
-3.149
-10.18%
jan 1, 1983
28.834
+1.064
3.83%
jan 1, 1984
32.651
+3.817
13.24%
jan 1, 1985
31.715
-0.936
-2.87%
jan 1, 1986
31.212
-0.503
-1.59%
jan 1, 1987
29.725
-1.486
-4.76%
jan 1, 1988
32.847
+3.122
10.5%
jan 1, 1989
33.468
+0.621
1.89%
jan 1, 1990
34.855
+1.387
4.14%
jan 1, 1991
40.191
+5.336
15.31%
jan 1, 1992
41.107
+0.917
2.28%
jan 1, 1993
39.865
-1.243
-3.02%
jan 1, 1994
35.846
-4.019
-10.08%
jan 1, 1995
32.522
-3.324
-9.27%
jan 1, 1996
32.09
-0.432
-1.33%
jan 1, 1997
32.615
+0.525
1.64%
jan 1, 1998
31.7
-0.915
-2.8%
jan 1, 1999
29.695
-2.005
-6.33%
jan 1, 2000
29.144
-0.551
-1.85%
jan 1, 2001
28.77
-0.374
-1.28%
jan 1, 2002
28.173
-0.598
-2.08%
jan 1, 2003
26.649
-1.524
-5.41%
jan 1, 2004
26.157
-0.492
-1.85%
jan 1, 2005
26.442
+0.285
1.09%
jan 1, 2006
27.65
+1.208
4.57%
jan 1, 2007
28.262
+0.612
2.21%
jan 1, 2008
29.841
+1.579
5.59%
jan 1, 2009
30.275
+0.434
1.46%
jan 1, 2010
29.054
-1.221
-4.03%
jan 1, 2011
30.453
+1.399
4.82%
jan 1, 2012
31.093
+0.639
2.1%
jan 1, 2013
31.305
+0.212
0.68%
jan 1, 2014
31.211
-0.094
-0.3%
jan 1, 2015
31.371
+0.16
0.51%
jan 1, 2016
30.509
-0.862
-2.75%
Ranking of countries by current statistics by years


Comments: