29
/
en
AIzaSyAYiBZKx7MnpbEhh9jyipgxe19OcubqV5w
April 1, 2024
30374
Euro area
EMU
false
2
1
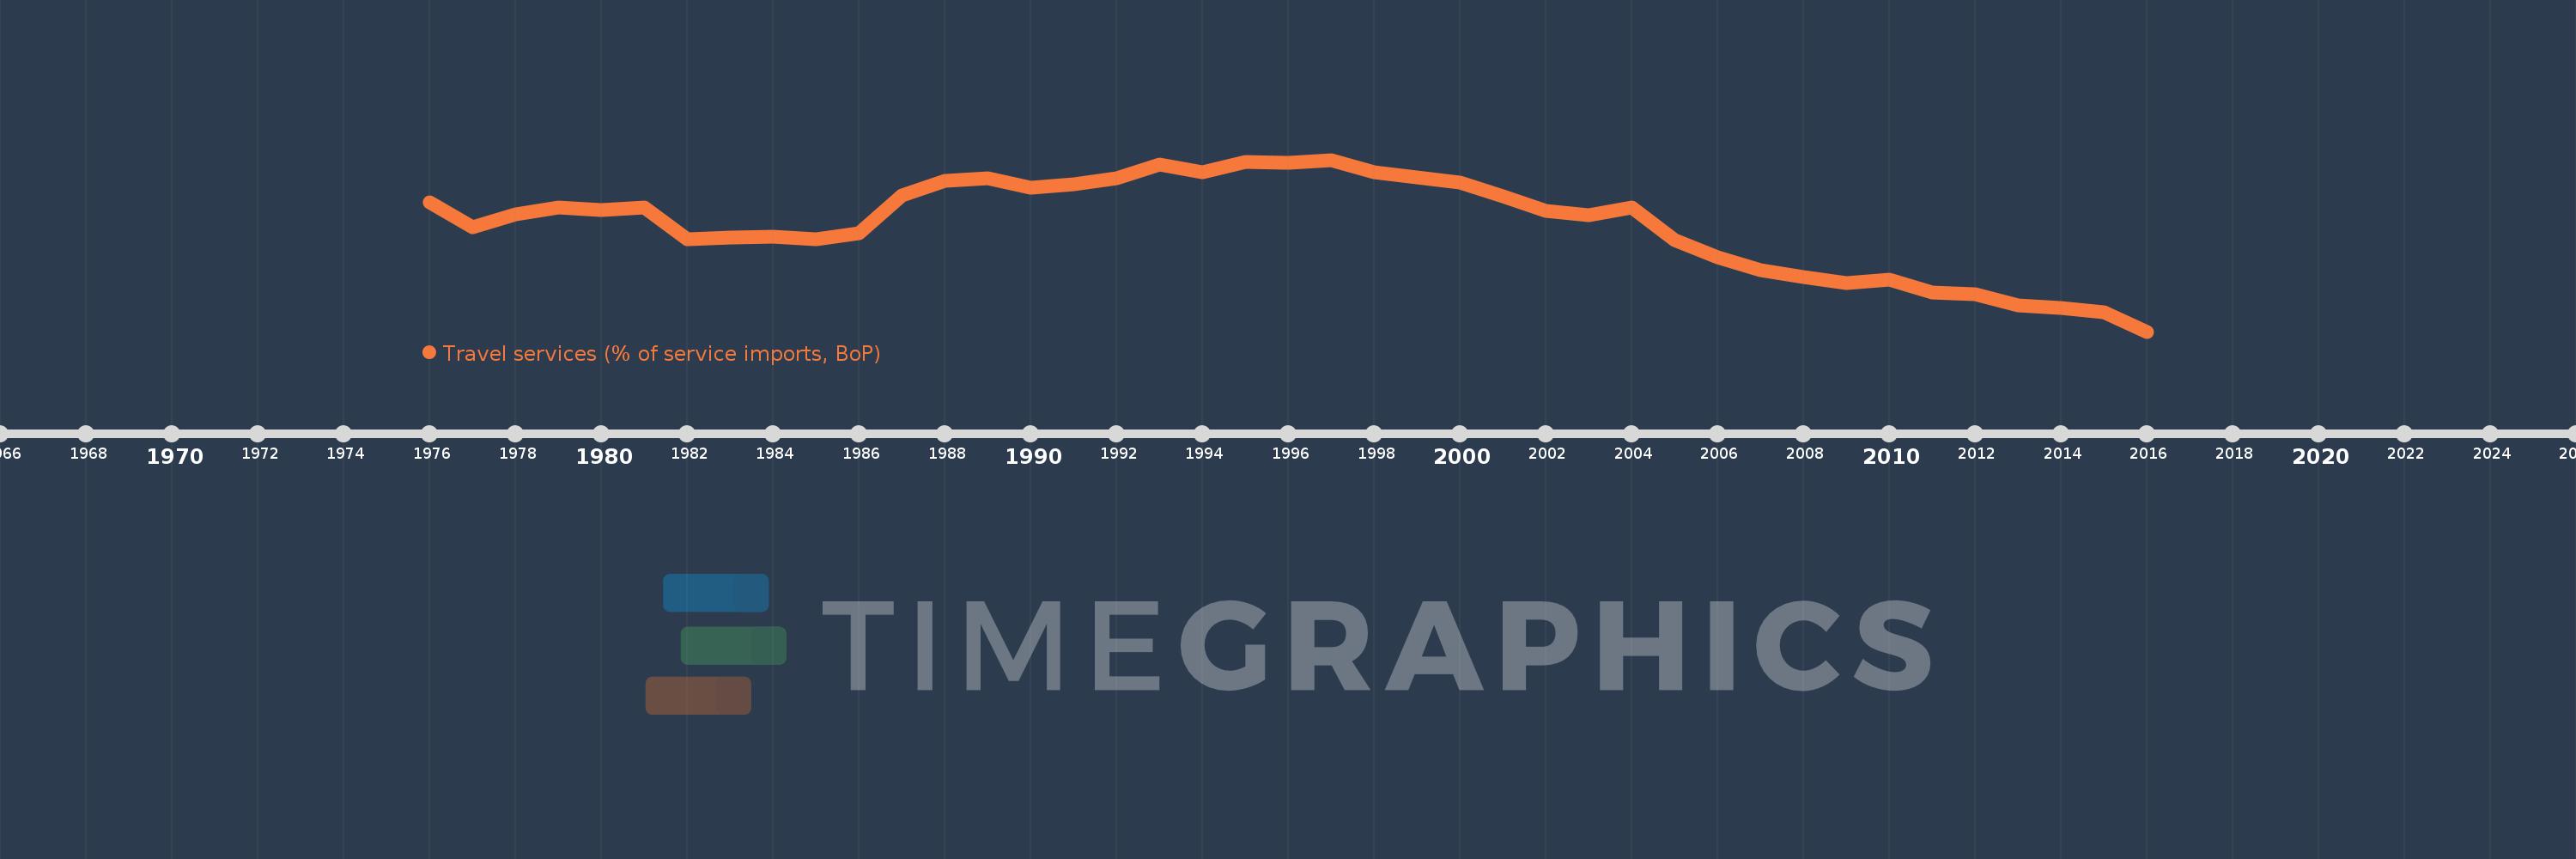
Travel services (% of service imports, BoP)
2016,2015,2014,2013,2012,2011,2010,2009,2008,2007,2006,2005,2004,2003,2002,2001,2000,1999,1998,1997,1996,1995,1994,1993,1992,1991,1990,1989,1988,1987,1986,1985,1984,1983,1982,1981,1980,1979,1978,1977,1976
This statistics in other country:
AfghanistanAlbaniaAlgeriaAngolaAntigua and BarbudaArab WorldArgentinaArmeniaArubaAustraliaAustriaAzerbaijanBahamas, TheBahrainBangladeshBarbadosBelarusBelgiumBelizeBeninBermudaBhutanBoliviaBosnia and HerzegovinaBotswanaBrazilBrunei DarussalamBulgariaBurkina FasoBurundiCabo VerdeCambodiaCameroonCanadaCaribbean small statesCentral African RepublicCentral Europe and the BalticsChadChileChinaColombiaComorosCongo, Dem. Rep.Congo, Rep.Costa RicaCote d'IvoireCroatiaCuracaoCyprusCzech RepublicDenmarkDjiboutiDominicaDominican RepublicEarly-demographic dividendEast Asia & PacificEast Asia & Pacific (excluding high income)East Asia & Pacific (IDA & IBRD countries)EcuadorEgypt, Arab Rep.El SalvadorEritreaEstoniaEthiopiaEuro areaEurope & Central AsiaEurope & Central Asia (excluding high income)Europe & Central Asia (IDA & IBRD countries)European UnionFaroe IslandsFijiFinlandFragile and conflict affected situationsFranceFrench PolynesiaGabonGambia, TheGeorgiaGermanyGhanaGreeceGrenadaGuatemalaGuineaGuinea-BissauGuyanaHaitiHeavily indebted poor countries (HIPC)High incomeHondurasHong Kong SAR, ChinaHungaryIBRD onlyIcelandIDA & IBRD totalIDA onlyIDA totalIndiaIndonesiaIran, Islamic Rep.IraqIrelandIsraelItalyJamaicaJapanJordanKazakhstanKenyaKiribatiKorea, Rep.KosovoKuwaitKyrgyz RepublicLao PDRLate-demographic dividendLatin America & Caribbean Latin America & Caribbean (excluding high income)Latin America & the Caribbean (IDA & IBRD countries)LatviaLeast developed countries: UN classificationLebanonLesothoLiberiaLibyaLithuaniaLow & middle incomeLow incomeLower middle incomeLuxembourgMacao SAR, ChinaMacedonia, FYRMadagascarMalawiMalaysiaMaldivesMaliMaltaMarshall IslandsMauritaniaMauritiusMexicoMicronesia, Fed. Sts.Middle East & North AfricaMiddle East & North Africa (excluding high income)Middle East & North Africa (IDA & IBRD countries)Middle incomeMoldovaMongoliaMontenegroMoroccoMozambiqueMyanmarNamibiaNepalNetherlandsNew CaledoniaNew ZealandNicaraguaNigerNigeriaNorth AmericaNorwayOECD membersOmanOther small statesPacific island small statesPakistanPalauPanamaPapua New GuineaParaguayPeruPhilippinesPolandPortugalPost-demographic dividendPre-demographic dividendQatarRomaniaRussian FederationRwandaSamoaSao Tome and PrincipeSaudi ArabiaSenegalSerbiaSeychellesSierra LeoneSingaporeSint Maarten (Dutch part)Slovak RepublicSloveniaSmall statesSolomon IslandsSouth AfricaSouth AsiaSouth Asia (IDA & IBRD)South SudanSpainSri LankaSt. Kitts and NevisSt. LuciaSt. Vincent and the GrenadinesSub-Saharan Africa Sub-Saharan Africa (excluding high income)Sub-Saharan Africa (IDA & IBRD countries)SudanSurinameSwazilandSwedenSwitzerlandSyrian Arab RepublicTajikistanTanzaniaThailandTimor-LesteTogoTongaTrinidad and TobagoTunisiaTurkeyTuvaluUgandaUkraineUnited KingdomUnited StatesUpper middle incomeUruguayVanuatuVenezuela, RBWest Bank and GazaWorldYemen, Rep.ZambiaZimbabwe Timeline:
This timeline shows a graph from 1976 to 2016 of Euro area. No data until 1975. Number of actual observations by date: 41.
Source name:
World Development Indicators
Source organization:
International Monetary Fund, Balance of Payments Statistics Yearbook and data files.
Categories, topics:
Economy & Growth, Trade
Last updated:
apr 23, 2017
Indicators value changes by year
Minimum:
17.441
jan 1, 2016
Maximum:
32.891
jan 1, 1997
At the date of observation
Value
Absolute change
Change from previous value
jan 1, 1976
29.105
+29.105
0.0%
jan 1, 1977
26.844
-2.26
-7.77%
jan 1, 1978
27.984
+1.14
4.25%
jan 1, 1979
28.585
+0.6
2.14%
jan 1, 1980
28.397
-0.188
-0.66%
jan 1, 1981
28.622
+0.226
0.8%
jan 1, 1982
25.712
-2.911
-10.17%
jan 1, 1983
25.883
+0.172
0.67%
jan 1, 1984
25.942
+0.059
0.23%
jan 1, 1985
25.743
-0.199
-0.77%
jan 1, 1986
26.308
+0.564
2.19%
jan 1, 1987
29.666
+3.359
12.77%
jan 1, 1988
30.994
+1.327
4.47%
jan 1, 1989
31.267
+0.273
0.88%
jan 1, 1990
30.357
-0.91
-2.91%
jan 1, 1991
30.704
+0.347
1.14%
jan 1, 1992
31.254
+0.55
1.79%
jan 1, 1993
32.445
+1.192
3.81%
jan 1, 1994
31.752
-0.694
-2.14%
jan 1, 1995
32.732
+0.98
3.09%
jan 1, 1996
32.639
-0.093
-0.28%
jan 1, 1997
32.891
+0.252
0.77%
jan 1, 1998
31.751
-1.14
-3.47%
jan 1, 1999
31.296
-0.455
-1.43%
jan 1, 2000
30.854
-0.442
-1.41%
jan 1, 2001
29.627
-1.227
-3.98%
jan 1, 2002
28.269
-1.358
-4.58%
jan 1, 2003
27.896
-0.372
-1.32%
jan 1, 2004
28.631
+0.734
2.63%
jan 1, 2005
25.69
-2.941
-10.27%
jan 1, 2006
24.132
-1.558
-6.07%
jan 1, 2007
22.974
-1.158
-4.8%
jan 1, 2008
22.329
-0.645
-2.81%
jan 1, 2009
21.799
-0.531
-2.38%
jan 1, 2010
22.089
+0.29
1.33%
jan 1, 2011
20.933
-1.156
-5.23%
jan 1, 2012
20.788
-0.145
-0.69%
jan 1, 2013
19.802
-0.986
-4.74%
jan 1, 2014
19.565
-0.238
-1.2%
jan 1, 2015
19.173
-0.391
-2.0%
jan 1, 2016
17.441
-1.732
-9.03%
Ranking of countries by current statistics by years


Comments: