29
/
en
AIzaSyAYiBZKx7MnpbEhh9jyipgxe19OcubqV5w
April 1, 2024
238845
Seychelles
SYC
true
2
1
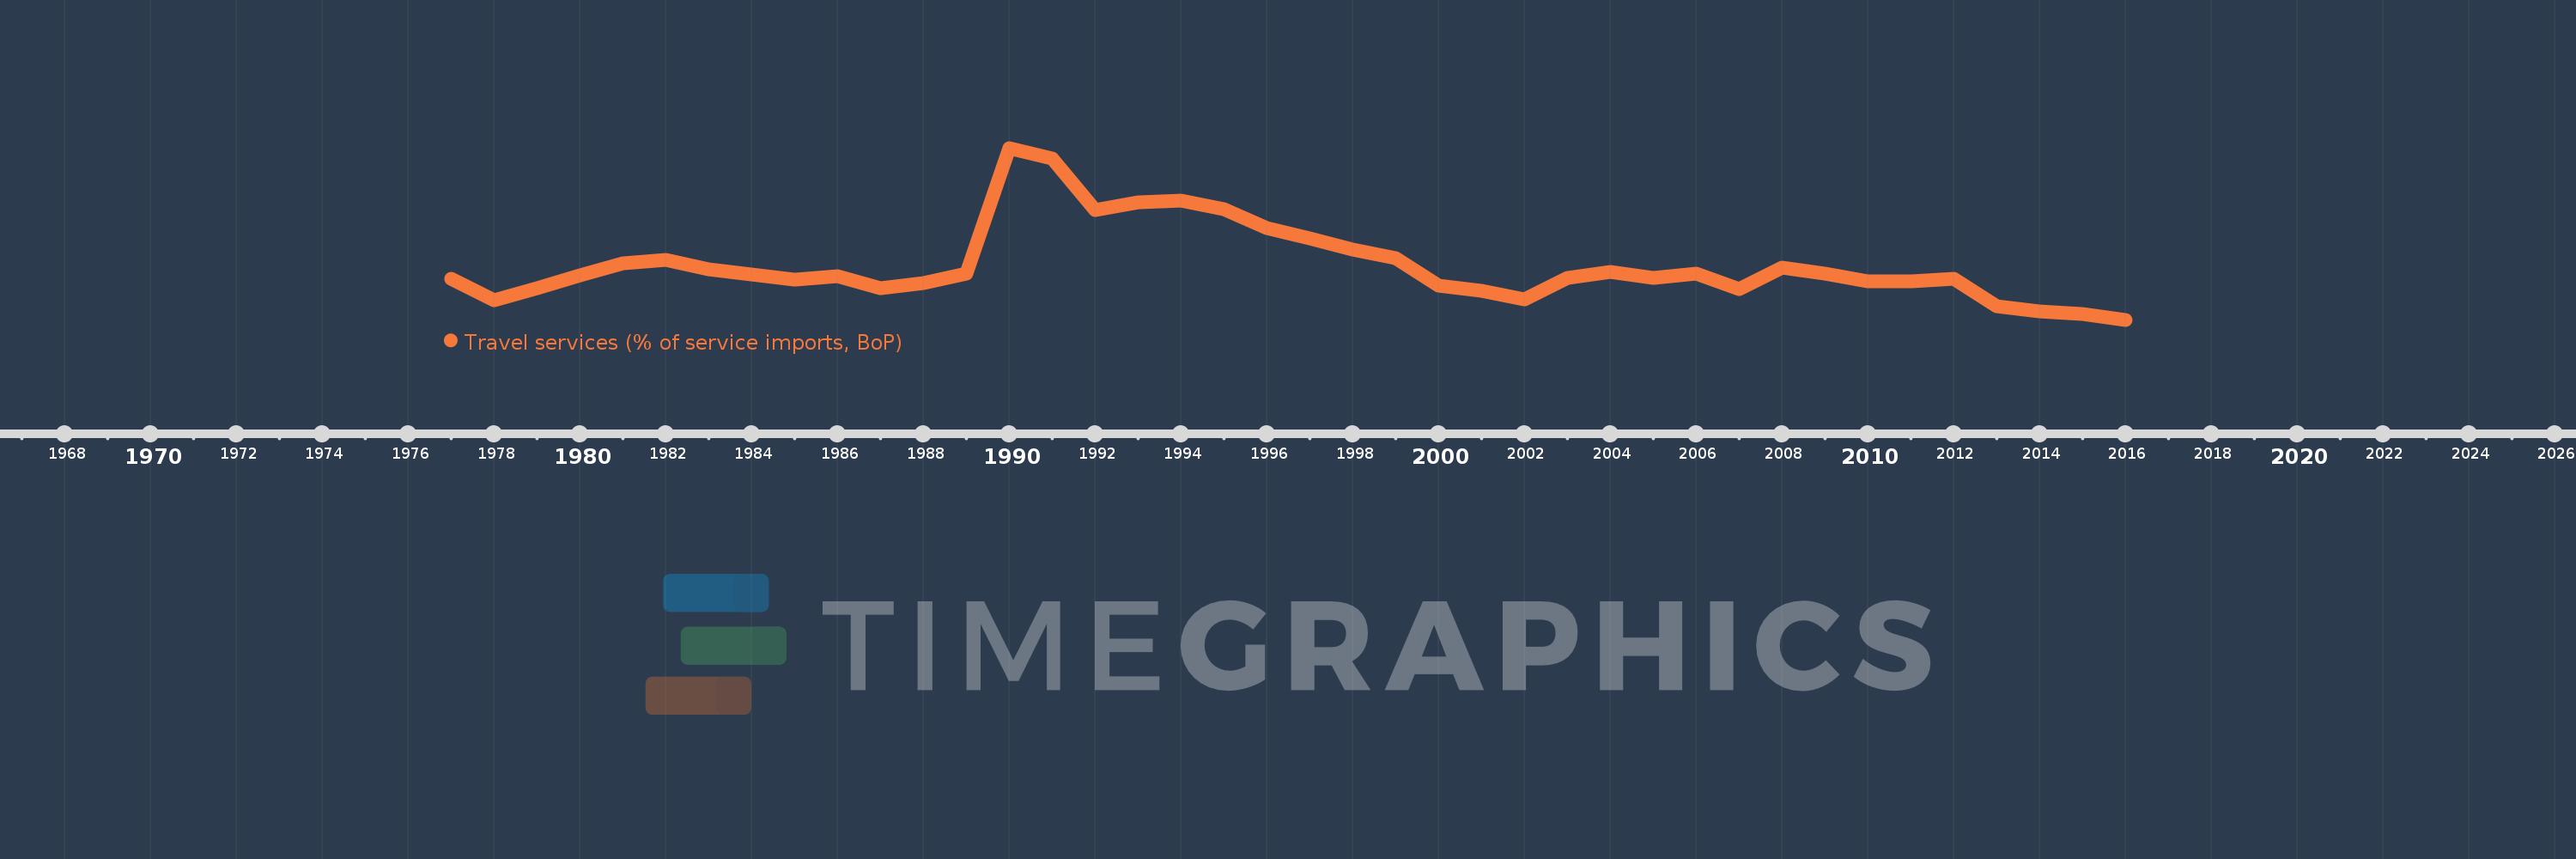
Travel services (% of service imports, BoP)
2016,2015,2014,2013,2012,2011,2010,2009,2008,2007,2006,2005,2004,2003,2002,2001,2000,1999,1998,1997,1996,1995,1994,1993,1992,1991,1990,1989,1988,1987,1986,1985,1984,1983,1982,1981,1980,1979,1978,1977
This statistics in other country:
AfghanistanAlbaniaAlgeriaAngolaAntigua and BarbudaArab WorldArgentinaArmeniaArubaAustraliaAustriaAzerbaijanBahamas, TheBahrainBangladeshBarbadosBelarusBelgiumBelizeBeninBermudaBhutanBoliviaBosnia and HerzegovinaBotswanaBrazilBrunei DarussalamBulgariaBurkina FasoBurundiCabo VerdeCambodiaCameroonCanadaCaribbean small statesCentral African RepublicCentral Europe and the BalticsChadChileChinaColombiaComorosCongo, Dem. Rep.Congo, Rep.Costa RicaCote d'IvoireCroatiaCuracaoCyprusCzech RepublicDenmarkDjiboutiDominicaDominican RepublicEarly-demographic dividendEast Asia & PacificEast Asia & Pacific (excluding high income)East Asia & Pacific (IDA & IBRD countries)EcuadorEgypt, Arab Rep.El SalvadorEritreaEstoniaEthiopiaEuro areaEurope & Central AsiaEurope & Central Asia (excluding high income)Europe & Central Asia (IDA & IBRD countries)European UnionFaroe IslandsFijiFinlandFragile and conflict affected situationsFranceFrench PolynesiaGabonGambia, TheGeorgiaGermanyGhanaGreeceGrenadaGuatemalaGuineaGuinea-BissauGuyanaHaitiHeavily indebted poor countries (HIPC)High incomeHondurasHong Kong SAR, ChinaHungaryIBRD onlyIcelandIDA & IBRD totalIDA onlyIDA totalIndiaIndonesiaIran, Islamic Rep.IraqIrelandIsraelItalyJamaicaJapanJordanKazakhstanKenyaKiribatiKorea, Rep.KosovoKuwaitKyrgyz RepublicLao PDRLate-demographic dividendLatin America & Caribbean Latin America & Caribbean (excluding high income)Latin America & the Caribbean (IDA & IBRD countries)LatviaLeast developed countries: UN classificationLebanonLesothoLiberiaLibyaLithuaniaLow & middle incomeLow incomeLower middle incomeLuxembourgMacao SAR, ChinaMacedonia, FYRMadagascarMalawiMalaysiaMaldivesMaliMaltaMarshall IslandsMauritaniaMauritiusMexicoMicronesia, Fed. Sts.Middle East & North AfricaMiddle East & North Africa (excluding high income)Middle East & North Africa (IDA & IBRD countries)Middle incomeMoldovaMongoliaMontenegroMoroccoMozambiqueMyanmarNamibiaNepalNetherlandsNew CaledoniaNew ZealandNicaraguaNigerNigeriaNorth AmericaNorwayOECD membersOmanOther small statesPacific island small statesPakistanPalauPanamaPapua New GuineaParaguayPeruPhilippinesPolandPortugalPost-demographic dividendPre-demographic dividendQatarRomaniaRussian FederationRwandaSamoaSao Tome and PrincipeSaudi ArabiaSenegalSerbiaSeychellesSierra LeoneSingaporeSint Maarten (Dutch part)Slovak RepublicSloveniaSmall statesSolomon IslandsSouth AfricaSouth AsiaSouth Asia (IDA & IBRD)South SudanSpainSri LankaSt. Kitts and NevisSt. LuciaSt. Vincent and the GrenadinesSub-Saharan Africa Sub-Saharan Africa (excluding high income)Sub-Saharan Africa (IDA & IBRD countries)SudanSurinameSwazilandSwedenSwitzerlandSyrian Arab RepublicTajikistanTanzaniaThailandTimor-LesteTogoTongaTrinidad and TobagoTunisiaTurkeyTuvaluUgandaUkraineUnited KingdomUnited StatesUpper middle incomeUruguayVanuatuVenezuela, RBWest Bank and GazaWorldYemen, Rep.ZambiaZimbabwe Timeline:
This timeline shows a graph from 1977 to 2016 of Seychelles. No data until 1976. Number of actual observations by date: 40.
Source name:
World Development Indicators
Source organization:
International Monetary Fund, Balance of Payments Statistics Yearbook and data files.
Categories, topics:
Economy & Growth, Trade
Last updated:
apr 23, 2017
Indicators value changes by year
Maximum:
43.233
jan 1, 1990
At the date of observation
Value
Absolute change
Change from previous value
jan 1, 1977
14.981
+14.981
0.0%
jan 1, 1978
10.241
-4.74
-31.64%
jan 1, 1979
12.9
+2.659
25.96%
jan 1, 1980
15.626
+2.726
21.13%
jan 1, 1981
18.348
+2.723
17.42%
jan 1, 1982
19.059
+0.711
3.87%
jan 1, 1983
17.067
-1.992
-10.45%
jan 1, 1984
15.833
-1.234
-7.23%
jan 1, 1985
14.757
-1.076
-6.8%
jan 1, 1986
15.462
+0.705
4.77%
jan 1, 1987
12.846
-2.616
-16.92%
jan 1, 1988
14.014
+1.169
9.1%
jan 1, 1989
16.047
+2.033
14.5%
jan 1, 1990
43.233
+27.186
169.41%
jan 1, 1991
40.933
-2.3
-5.32%
jan 1, 1992
29.877
-11.056
-27.01%
jan 1, 1993
31.472
+1.595
5.34%
jan 1, 1994
31.889
+0.417
1.32%
jan 1, 1995
30.066
-1.823
-5.72%
jan 1, 1996
25.895
-4.171
-13.87%
jan 1, 1997
23.586
-2.308
-8.91%
jan 1, 1998
21.335
-2.252
-9.55%
jan 1, 1999
19.314
-2.02
-9.47%
jan 1, 2000
13.427
-5.887
-30.48%
jan 1, 2001
12.403
-1.024
-7.62%
jan 1, 2002
10.436
-1.967
-15.86%
jan 1, 2003
15.048
+4.611
44.18%
jan 1, 2004
16.38
+1.333
8.86%
jan 1, 2005
15.19
-1.191
-7.27%
jan 1, 2006
16.091
+0.902
5.94%
jan 1, 2007
12.707
-3.384
-21.03%
jan 1, 2008
17.362
+4.655
36.64%
jan 1, 2009
16.051
-1.312
-7.56%
jan 1, 2010
14.353
-1.697
-10.57%
jan 1, 2011
14.425
+0.072
0.5%
jan 1, 2012
14.98
+0.555
3.85%
jan 1, 2013
8.953
-6.027
-40.23%
jan 1, 2014
7.868
-1.085
-12.12%
jan 1, 2015
7.401
-0.467
-5.94%
jan 1, 2016
6.079
-1.321
-17.86%
Ranking of countries by current statistics by years


Comments: