29
/
en
AIzaSyAYiBZKx7MnpbEhh9jyipgxe19OcubqV5w
April 1, 2024
249576
Sri Lanka
LKA
true
2
1
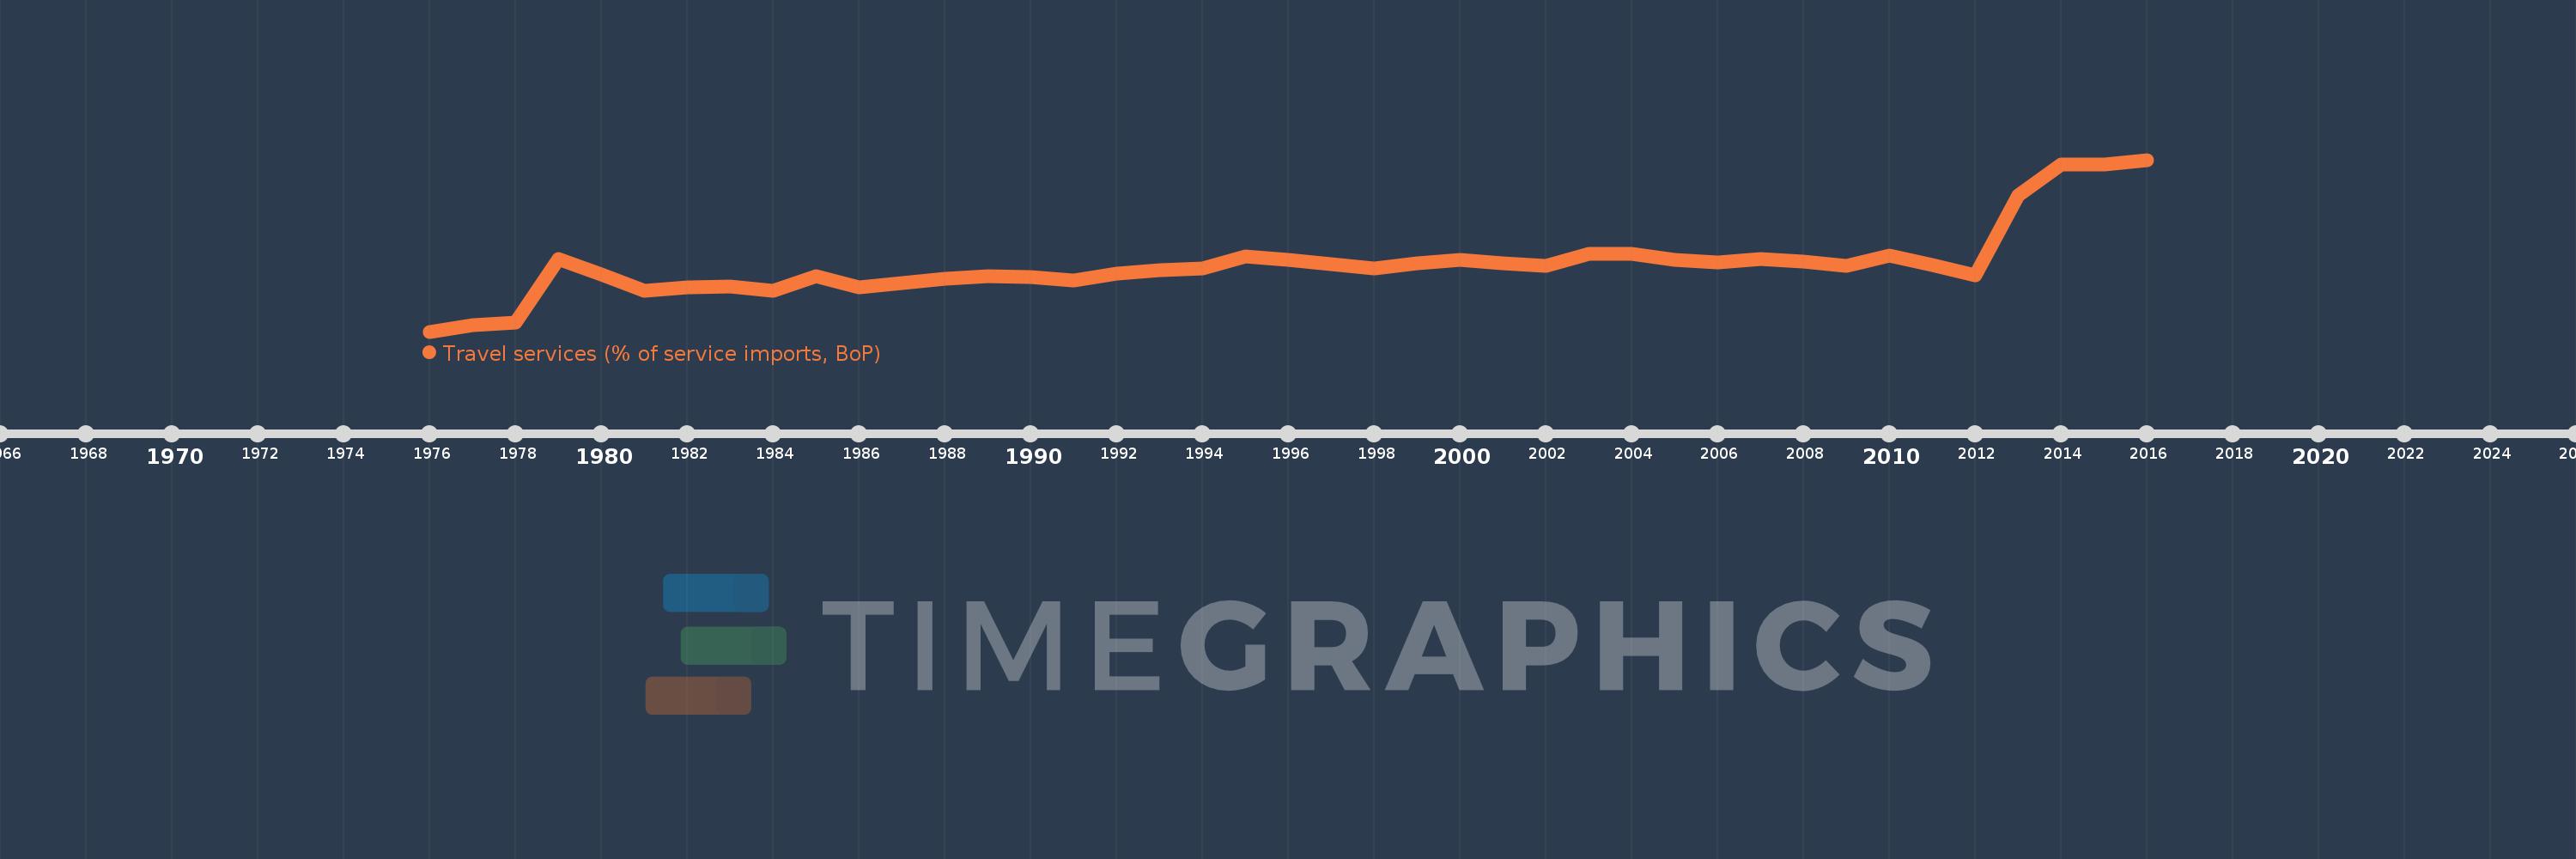
Travel services (% of service imports, BoP)
2016,2015,2014,2013,2012,2011,2010,2009,2008,2007,2006,2005,2004,2003,2002,2001,2000,1999,1998,1997,1996,1995,1994,1993,1992,1991,1990,1989,1988,1987,1986,1985,1984,1983,1982,1981,1980,1979,1978,1977,1976
This statistics in other country:
AfghanistanAlbaniaAlgeriaAngolaAntigua and BarbudaArab WorldArgentinaArmeniaArubaAustraliaAustriaAzerbaijanBahamas, TheBahrainBangladeshBarbadosBelarusBelgiumBelizeBeninBermudaBhutanBoliviaBosnia and HerzegovinaBotswanaBrazilBrunei DarussalamBulgariaBurkina FasoBurundiCabo VerdeCambodiaCameroonCanadaCaribbean small statesCentral African RepublicCentral Europe and the BalticsChadChileChinaColombiaComorosCongo, Dem. Rep.Congo, Rep.Costa RicaCote d'IvoireCroatiaCuracaoCyprusCzech RepublicDenmarkDjiboutiDominicaDominican RepublicEarly-demographic dividendEast Asia & PacificEast Asia & Pacific (excluding high income)East Asia & Pacific (IDA & IBRD countries)EcuadorEgypt, Arab Rep.El SalvadorEritreaEstoniaEthiopiaEuro areaEurope & Central AsiaEurope & Central Asia (excluding high income)Europe & Central Asia (IDA & IBRD countries)European UnionFaroe IslandsFijiFinlandFragile and conflict affected situationsFranceFrench PolynesiaGabonGambia, TheGeorgiaGermanyGhanaGreeceGrenadaGuatemalaGuineaGuinea-BissauGuyanaHaitiHeavily indebted poor countries (HIPC)High incomeHondurasHong Kong SAR, ChinaHungaryIBRD onlyIcelandIDA & IBRD totalIDA onlyIDA totalIndiaIndonesiaIran, Islamic Rep.IraqIrelandIsraelItalyJamaicaJapanJordanKazakhstanKenyaKiribatiKorea, Rep.KosovoKuwaitKyrgyz RepublicLao PDRLate-demographic dividendLatin America & Caribbean Latin America & Caribbean (excluding high income)Latin America & the Caribbean (IDA & IBRD countries)LatviaLeast developed countries: UN classificationLebanonLesothoLiberiaLibyaLithuaniaLow & middle incomeLow incomeLower middle incomeLuxembourgMacao SAR, ChinaMacedonia, FYRMadagascarMalawiMalaysiaMaldivesMaliMaltaMarshall IslandsMauritaniaMauritiusMexicoMicronesia, Fed. Sts.Middle East & North AfricaMiddle East & North Africa (excluding high income)Middle East & North Africa (IDA & IBRD countries)Middle incomeMoldovaMongoliaMontenegroMoroccoMozambiqueMyanmarNamibiaNepalNetherlandsNew CaledoniaNew ZealandNicaraguaNigerNigeriaNorth AmericaNorwayOECD membersOmanOther small statesPacific island small statesPakistanPalauPanamaPapua New GuineaParaguayPeruPhilippinesPolandPortugalPost-demographic dividendPre-demographic dividendQatarRomaniaRussian FederationRwandaSamoaSao Tome and PrincipeSaudi ArabiaSenegalSerbiaSeychellesSierra LeoneSingaporeSint Maarten (Dutch part)Slovak RepublicSloveniaSmall statesSolomon IslandsSouth AfricaSouth AsiaSouth Asia (IDA & IBRD)South SudanSpainSri LankaSt. Kitts and NevisSt. LuciaSt. Vincent and the GrenadinesSub-Saharan Africa Sub-Saharan Africa (excluding high income)Sub-Saharan Africa (IDA & IBRD countries)SudanSurinameSwazilandSwedenSwitzerlandSyrian Arab RepublicTajikistanTanzaniaThailandTimor-LesteTogoTongaTrinidad and TobagoTunisiaTurkeyTuvaluUgandaUkraineUnited KingdomUnited StatesUpper middle incomeUruguayVanuatuVenezuela, RBWest Bank and GazaWorldYemen, Rep.ZambiaZimbabwe Timeline:
This timeline shows a graph from 1976 to 2016 of Sri Lanka. No data until 1975. Number of actual observations by date: 41.
Source name:
World Development Indicators
Source organization:
International Monetary Fund, Balance of Payments Statistics Yearbook and data files.
Categories, topics:
Economy & Growth, Trade
Last updated:
apr 23, 2017
Indicators value changes by year
Maximum:
34.864
jan 1, 2016
At the date of observation
Value
Absolute change
Change from previous value
jan 1, 1976
1.58
+1.58
0.0%
jan 1, 1977
2.759
+1.179
74.64%
jan 1, 1978
3.325
+0.567
20.55%
jan 1, 1979
15.687
+12.361
371.72%
jan 1, 1980
12.632
-3.055
-19.47%
jan 1, 1981
9.517
-3.115
-24.66%
jan 1, 1982
10.202
+0.685
7.2%
jan 1, 1983
10.34
+0.139
1.36%
jan 1, 1984
9.522
-0.818
-7.91%
jan 1, 1985
12.282
+2.76
28.99%
jan 1, 1986
10.138
-2.144
-17.46%
jan 1, 1987
11.047
+0.909
8.97%
jan 1, 1988
11.752
+0.705
6.38%
jan 1, 1989
12.393
+0.641
5.45%
jan 1, 1990
12.176
-0.217
-1.75%
jan 1, 1991
11.534
-0.642
-5.27%
jan 1, 1992
12.748
+1.214
10.52%
jan 1, 1993
13.467
+0.719
5.64%
jan 1, 1994
13.756
+0.288
2.14%
jan 1, 1995
16.116
+2.361
17.16%
jan 1, 1996
15.543
-0.573
-3.55%
jan 1, 1997
14.594
-0.949
-6.11%
jan 1, 1998
13.786
-0.808
-5.54%
jan 1, 1999
14.836
+1.051
7.62%
jan 1, 2000
15.419
+0.582
3.93%
jan 1, 2001
14.819
-0.6
-3.89%
jan 1, 2002
14.316
-0.503
-3.4%
jan 1, 2003
16.587
+2.271
15.86%
jan 1, 2004
16.608
+0.022
0.13%
jan 1, 2005
15.514
-1.094
-6.59%
jan 1, 2006
15.055
-0.458
-2.96%
jan 1, 2007
15.587
+0.532
3.53%
jan 1, 2008
15.101
-0.486
-3.12%
jan 1, 2009
14.233
-0.868
-5.75%
jan 1, 2010
16.29
+2.057
14.45%
jan 1, 2011
14.542
-1.748
-10.73%
jan 1, 2012
12.496
-2.045
-14.07%
jan 1, 2013
27.986
+15.49
123.96%
jan 1, 2014
33.895
+5.909
21.11%
jan 1, 2015
33.895
0.0
0.0%
jan 1, 2016
34.864
+0.97
2.86%
Ranking of countries by current statistics by years


Comments: