29
/
en
AIzaSyAYiBZKx7MnpbEhh9jyipgxe19OcubqV5w
April 1, 2024
162076
Italy
ITA
true
2
1
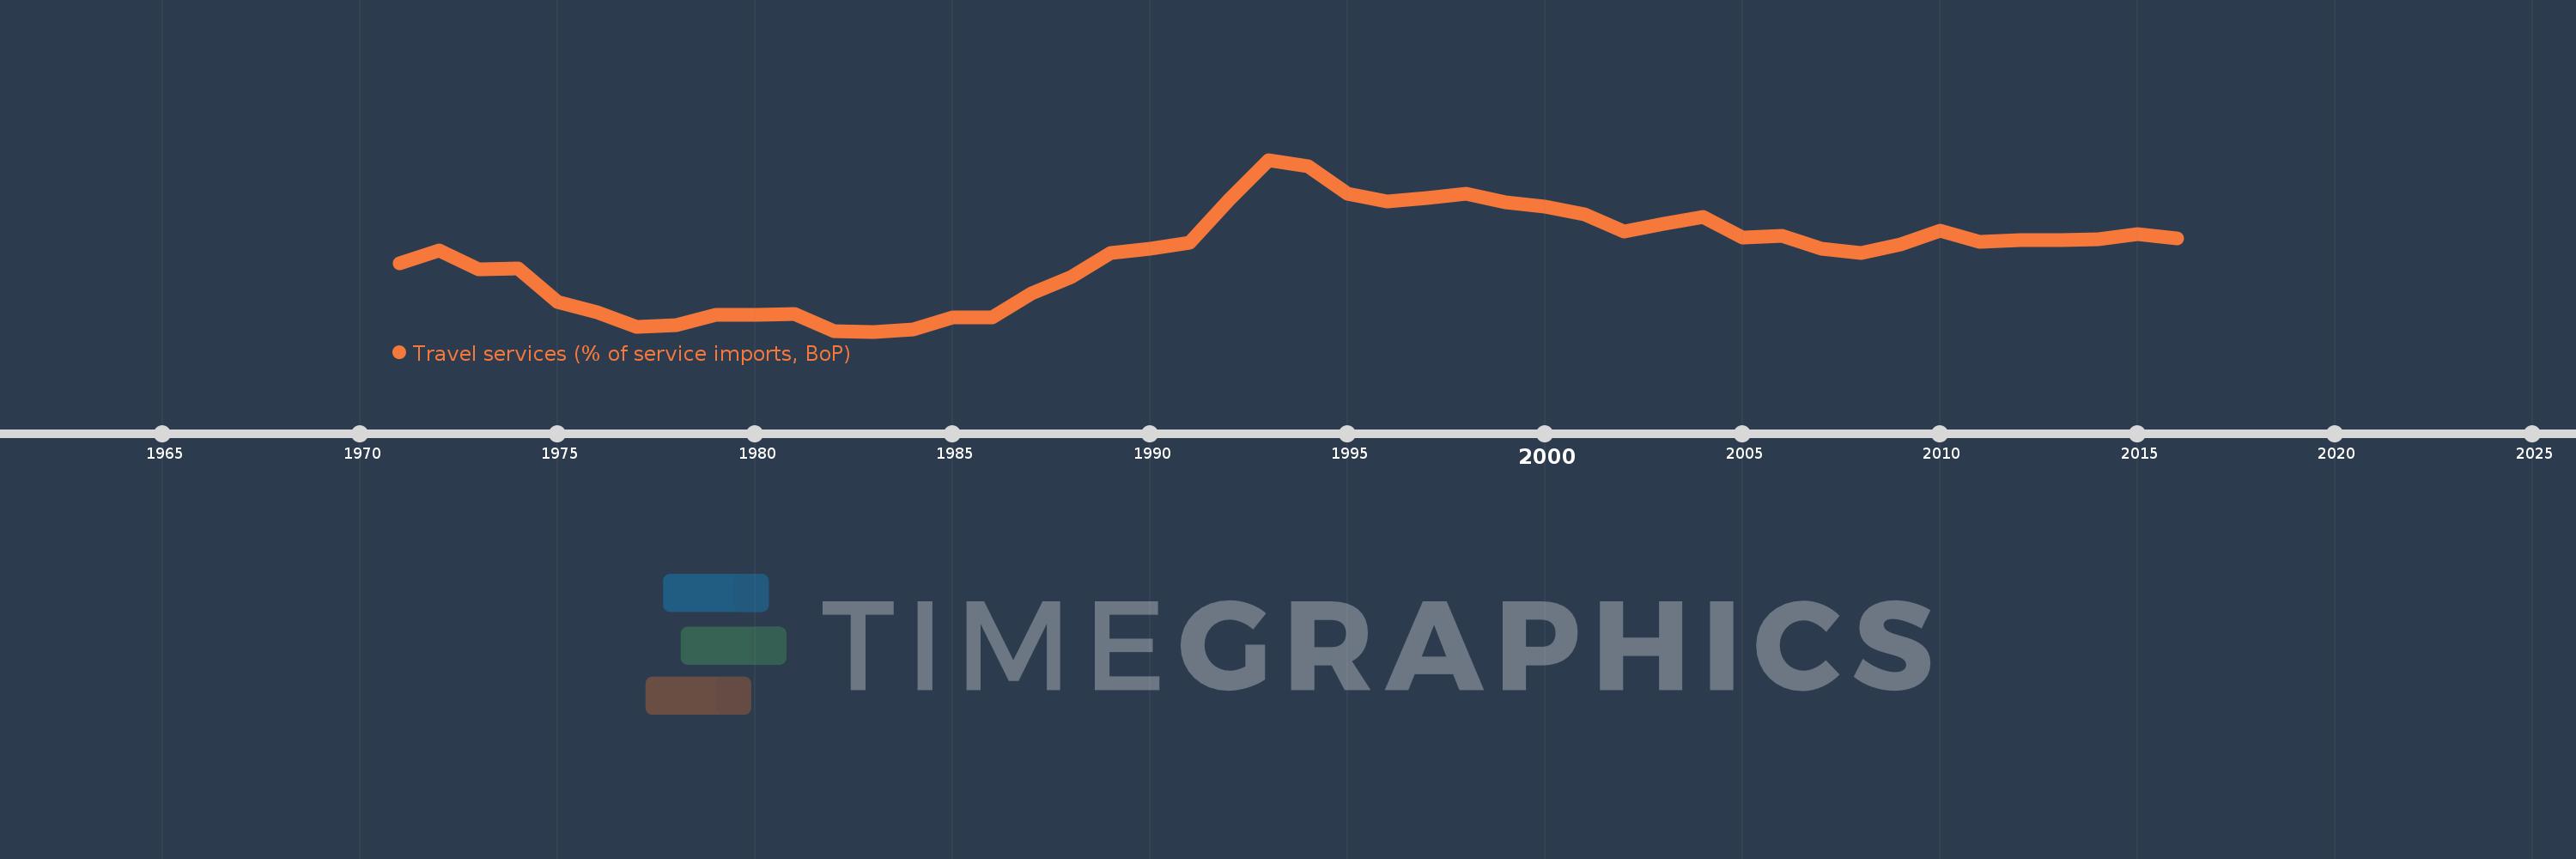
Travel services (% of service imports, BoP)
2016,2015,2014,2013,2012,2011,2010,2009,2008,2007,2006,2005,2004,2003,2002,2001,2000,1999,1998,1997,1996,1995,1994,1993,1992,1991,1990,1989,1988,1987,1986,1985,1984,1983,1982,1981,1980,1979,1978,1977,1976,1975,1974,1973,1972,1971
This statistics in other country:
AfghanistanAlbaniaAlgeriaAngolaAntigua and BarbudaArab WorldArgentinaArmeniaArubaAustraliaAustriaAzerbaijanBahamas, TheBahrainBangladeshBarbadosBelarusBelgiumBelizeBeninBermudaBhutanBoliviaBosnia and HerzegovinaBotswanaBrazilBrunei DarussalamBulgariaBurkina FasoBurundiCabo VerdeCambodiaCameroonCanadaCaribbean small statesCentral African RepublicCentral Europe and the BalticsChadChileChinaColombiaComorosCongo, Dem. Rep.Congo, Rep.Costa RicaCote d'IvoireCroatiaCuracaoCyprusCzech RepublicDenmarkDjiboutiDominicaDominican RepublicEarly-demographic dividendEast Asia & PacificEast Asia & Pacific (excluding high income)East Asia & Pacific (IDA & IBRD countries)EcuadorEgypt, Arab Rep.El SalvadorEritreaEstoniaEthiopiaEuro areaEurope & Central AsiaEurope & Central Asia (excluding high income)Europe & Central Asia (IDA & IBRD countries)European UnionFaroe IslandsFijiFinlandFragile and conflict affected situationsFranceFrench PolynesiaGabonGambia, TheGeorgiaGermanyGhanaGreeceGrenadaGuatemalaGuineaGuinea-BissauGuyanaHaitiHeavily indebted poor countries (HIPC)High incomeHondurasHong Kong SAR, ChinaHungaryIBRD onlyIcelandIDA & IBRD totalIDA onlyIDA totalIndiaIndonesiaIran, Islamic Rep.IraqIrelandIsraelItalyJamaicaJapanJordanKazakhstanKenyaKiribatiKorea, Rep.KosovoKuwaitKyrgyz RepublicLao PDRLate-demographic dividendLatin America & Caribbean Latin America & Caribbean (excluding high income)Latin America & the Caribbean (IDA & IBRD countries)LatviaLeast developed countries: UN classificationLebanonLesothoLiberiaLibyaLithuaniaLow & middle incomeLow incomeLower middle incomeLuxembourgMacao SAR, ChinaMacedonia, FYRMadagascarMalawiMalaysiaMaldivesMaliMaltaMarshall IslandsMauritaniaMauritiusMexicoMicronesia, Fed. Sts.Middle East & North AfricaMiddle East & North Africa (excluding high income)Middle East & North Africa (IDA & IBRD countries)Middle incomeMoldovaMongoliaMontenegroMoroccoMozambiqueMyanmarNamibiaNepalNetherlandsNew CaledoniaNew ZealandNicaraguaNigerNigeriaNorth AmericaNorwayOECD membersOmanOther small statesPacific island small statesPakistanPalauPanamaPapua New GuineaParaguayPeruPhilippinesPolandPortugalPost-demographic dividendPre-demographic dividendQatarRomaniaRussian FederationRwandaSamoaSao Tome and PrincipeSaudi ArabiaSenegalSerbiaSeychellesSierra LeoneSingaporeSint Maarten (Dutch part)Slovak RepublicSloveniaSmall statesSolomon IslandsSouth AfricaSouth AsiaSouth Asia (IDA & IBRD)South SudanSpainSri LankaSt. Kitts and NevisSt. LuciaSt. Vincent and the GrenadinesSub-Saharan Africa Sub-Saharan Africa (excluding high income)Sub-Saharan Africa (IDA & IBRD countries)SudanSurinameSwazilandSwedenSwitzerlandSyrian Arab RepublicTajikistanTanzaniaThailandTimor-LesteTogoTongaTrinidad and TobagoTunisiaTurkeyTuvaluUgandaUkraineUnited KingdomUnited StatesUpper middle incomeUruguayVanuatuVenezuela, RBWest Bank and GazaWorldYemen, Rep.ZambiaZimbabwe Timeline:
This timeline shows a graph from 1971 to 2016 of Italy. No data until 1970. Number of actual observations by date: 46.
Source name:
World Development Indicators
Source organization:
International Monetary Fund, Balance of Payments Statistics Yearbook and data files.
Categories, topics:
Economy & Growth, Trade
Last updated:
apr 23, 2017
Indicators value changes by year
Minimum:
10.399
jan 1, 1983
Maximum:
36.167
jan 1, 1993
At the date of observation
Value
Absolute change
Change from previous value
jan 1, 1971
20.682
+20.682
0.0%
jan 1, 1972
22.571
+1.889
9.13%
jan 1, 1973
19.713
-2.858
-12.66%
jan 1, 1974
19.858
+0.145
0.73%
jan 1, 1975
14.873
-4.984
-25.1%
jan 1, 1976
13.275
-1.599
-10.75%
jan 1, 1977
11.111
-2.164
-16.3%
jan 1, 1978
11.391
+0.28
2.52%
jan 1, 1979
12.918
+1.527
13.41%
jan 1, 1980
12.956
+0.037
0.29%
jan 1, 1981
13.067
+0.111
0.86%
jan 1, 1982
10.406
-2.661
-20.36%
jan 1, 1983
10.399
-0.007
-0.07%
jan 1, 1984
10.661
+0.262
2.52%
jan 1, 1985
12.495
+1.833
17.2%
jan 1, 1986
12.562
+0.067
0.54%
jan 1, 1987
16.069
+3.507
27.92%
jan 1, 1988
18.589
+2.52
15.69%
jan 1, 1989
22.229
+3.639
19.58%
jan 1, 1990
22.808
+0.58
2.61%
jan 1, 1991
23.772
+0.964
4.23%
jan 1, 1992
30.152
+6.38
26.84%
jan 1, 1993
36.167
+6.015
19.95%
jan 1, 1994
35.179
-0.989
-2.73%
jan 1, 1995
31.058
-4.12
-11.71%
jan 1, 1996
29.892
-1.166
-3.75%
jan 1, 1997
30.397
+0.505
1.69%
jan 1, 1998
31.106
+0.709
2.33%
jan 1, 1999
29.853
-1.253
-4.03%
jan 1, 2000
29.087
-0.766
-2.57%
jan 1, 2001
27.974
-1.113
-3.83%
jan 1, 2002
25.442
-2.532
-9.05%
jan 1, 2003
26.531
+1.089
4.28%
jan 1, 2004
27.572
+1.041
3.92%
jan 1, 2005
24.474
-3.098
-11.24%
jan 1, 2006
24.706
+0.231
0.95%
jan 1, 2007
22.869
-1.836
-7.43%
jan 1, 2008
22.218
-0.652
-2.85%
jan 1, 2009
23.421
+1.203
5.41%
jan 1, 2010
25.505
+2.084
8.9%
jan 1, 2011
23.801
-1.704
-6.68%
jan 1, 2012
24.142
+0.341
1.43%
jan 1, 2013
24.154
+0.012
0.05%
jan 1, 2014
24.187
+0.033
0.14%
jan 1, 2015
25.062
+0.875
3.62%
jan 1, 2016
24.327
-0.735
-2.93%
Ranking of countries by current statistics by years


Comments: