29
/
en
AIzaSyAYiBZKx7MnpbEhh9jyipgxe19OcubqV5w
April 1, 2024
199982
Mongolia
MNG
true
2
1
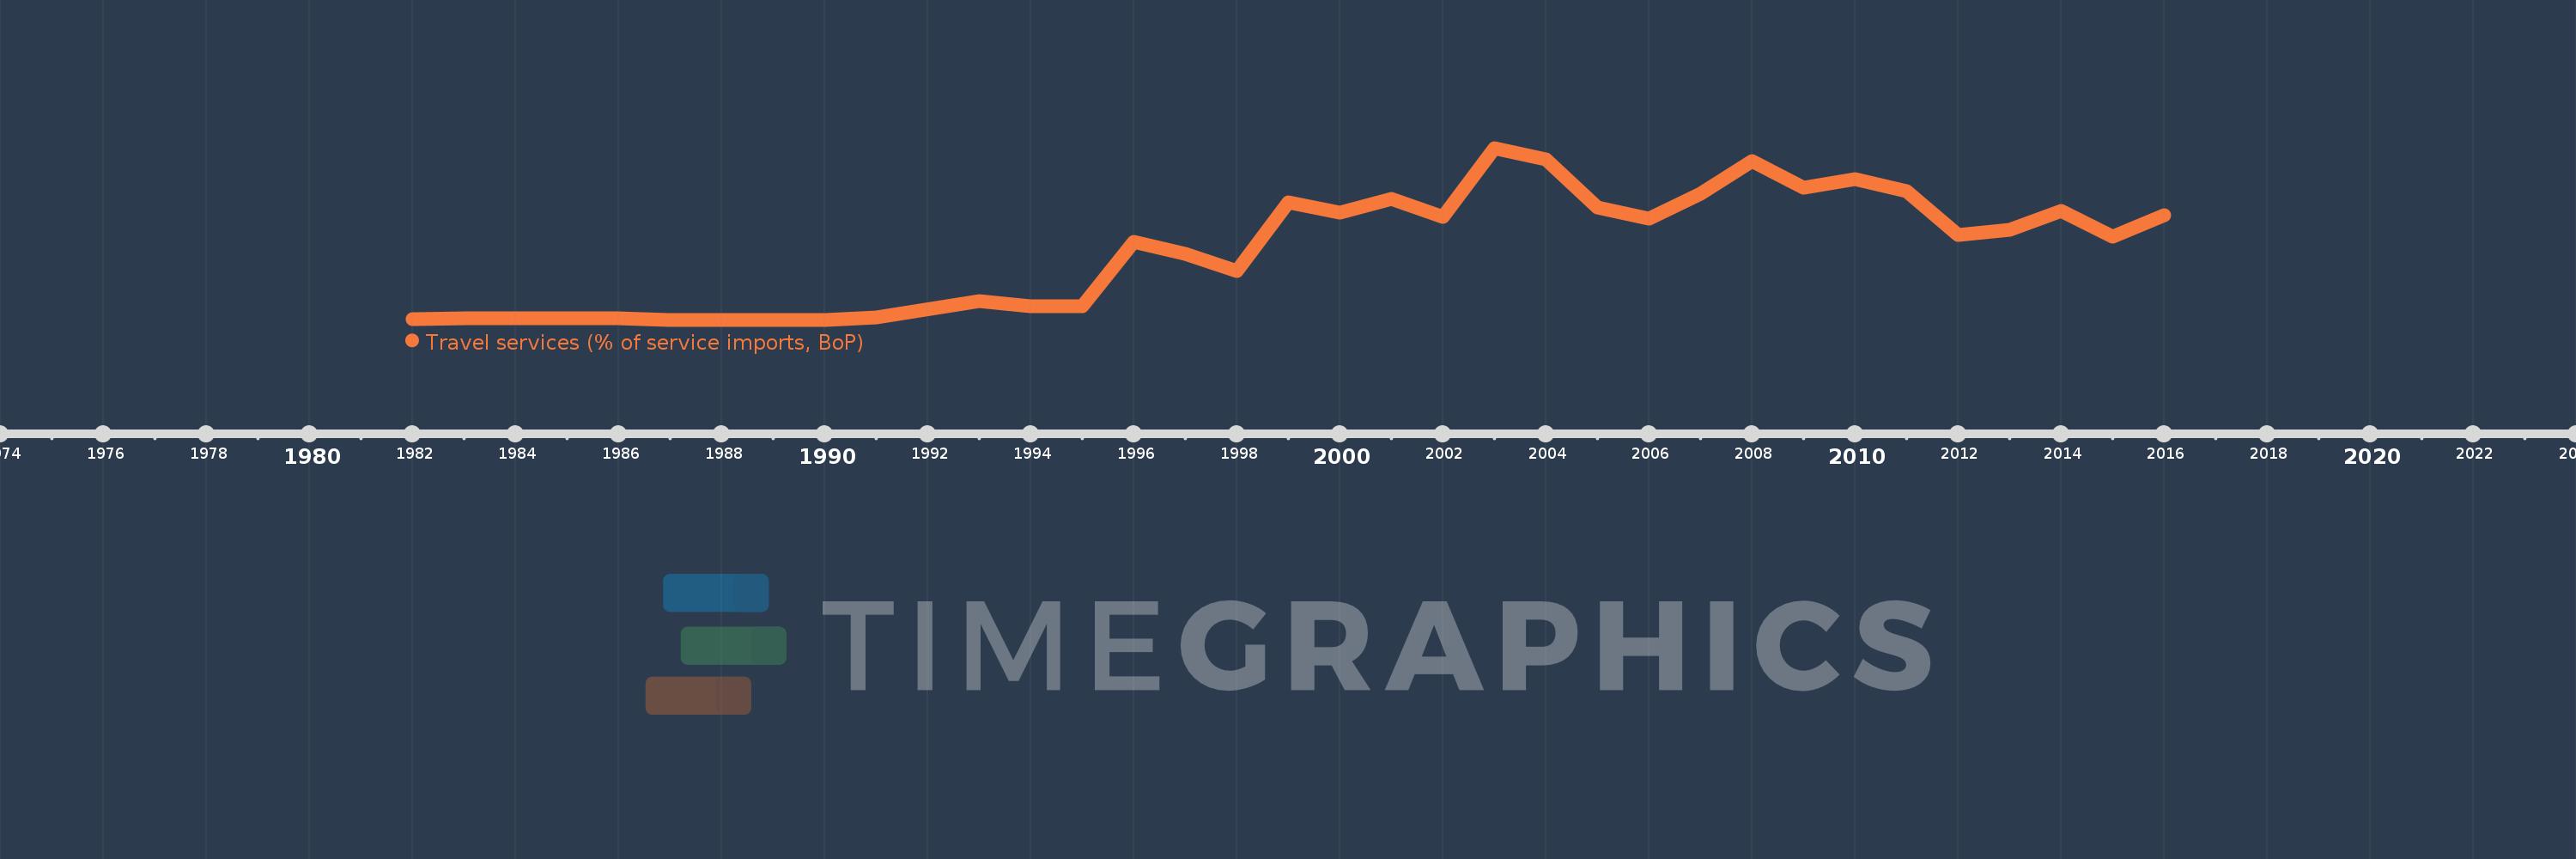
Travel services (% of service imports, BoP)
2016,2015,2014,2013,2012,2011,2010,2009,2008,2007,2006,2005,2004,2003,2002,2001,2000,1999,1998,1997,1996,1995,1994,1993,1991,1990,1989,1988,1987,1986,1985,1984,1983,1982
This statistics in other country:
AfghanistanAlbaniaAlgeriaAngolaAntigua and BarbudaArab WorldArgentinaArmeniaArubaAustraliaAustriaAzerbaijanBahamas, TheBahrainBangladeshBarbadosBelarusBelgiumBelizeBeninBermudaBhutanBoliviaBosnia and HerzegovinaBotswanaBrazilBrunei DarussalamBulgariaBurkina FasoBurundiCabo VerdeCambodiaCameroonCanadaCaribbean small statesCentral African RepublicCentral Europe and the BalticsChadChileChinaColombiaComorosCongo, Dem. Rep.Congo, Rep.Costa RicaCote d'IvoireCroatiaCuracaoCyprusCzech RepublicDenmarkDjiboutiDominicaDominican RepublicEarly-demographic dividendEast Asia & PacificEast Asia & Pacific (excluding high income)East Asia & Pacific (IDA & IBRD countries)EcuadorEgypt, Arab Rep.El SalvadorEritreaEstoniaEthiopiaEuro areaEurope & Central AsiaEurope & Central Asia (excluding high income)Europe & Central Asia (IDA & IBRD countries)European UnionFaroe IslandsFijiFinlandFragile and conflict affected situationsFranceFrench PolynesiaGabonGambia, TheGeorgiaGermanyGhanaGreeceGrenadaGuatemalaGuineaGuinea-BissauGuyanaHaitiHeavily indebted poor countries (HIPC)High incomeHondurasHong Kong SAR, ChinaHungaryIBRD onlyIcelandIDA & IBRD totalIDA onlyIDA totalIndiaIndonesiaIran, Islamic Rep.IraqIrelandIsraelItalyJamaicaJapanJordanKazakhstanKenyaKiribatiKorea, Rep.KosovoKuwaitKyrgyz RepublicLao PDRLate-demographic dividendLatin America & Caribbean Latin America & Caribbean (excluding high income)Latin America & the Caribbean (IDA & IBRD countries)LatviaLeast developed countries: UN classificationLebanonLesothoLiberiaLibyaLithuaniaLow & middle incomeLow incomeLower middle incomeLuxembourgMacao SAR, ChinaMacedonia, FYRMadagascarMalawiMalaysiaMaldivesMaliMaltaMarshall IslandsMauritaniaMauritiusMexicoMicronesia, Fed. Sts.Middle East & North AfricaMiddle East & North Africa (excluding high income)Middle East & North Africa (IDA & IBRD countries)Middle incomeMoldovaMongoliaMontenegroMoroccoMozambiqueMyanmarNamibiaNepalNetherlandsNew CaledoniaNew ZealandNicaraguaNigerNigeriaNorth AmericaNorwayOECD membersOmanOther small statesPacific island small statesPakistanPalauPanamaPapua New GuineaParaguayPeruPhilippinesPolandPortugalPost-demographic dividendPre-demographic dividendQatarRomaniaRussian FederationRwandaSamoaSao Tome and PrincipeSaudi ArabiaSenegalSerbiaSeychellesSierra LeoneSingaporeSint Maarten (Dutch part)Slovak RepublicSloveniaSmall statesSolomon IslandsSouth AfricaSouth AsiaSouth Asia (IDA & IBRD)South SudanSpainSri LankaSt. Kitts and NevisSt. LuciaSt. Vincent and the GrenadinesSub-Saharan Africa Sub-Saharan Africa (excluding high income)Sub-Saharan Africa (IDA & IBRD countries)SudanSurinameSwazilandSwedenSwitzerlandSyrian Arab RepublicTajikistanTanzaniaThailandTimor-LesteTogoTongaTrinidad and TobagoTunisiaTurkeyTuvaluUgandaUkraineUnited KingdomUnited StatesUpper middle incomeUruguayVanuatuVenezuela, RBWest Bank and GazaWorldYemen, Rep.ZambiaZimbabwe Timeline:
This timeline shows a graph from 1982 to 2016 of Mongolia. No data until 1981. Number of actual observations by date: 34.
Source name:
World Development Indicators
Source organization:
International Monetary Fund, Balance of Payments Statistics Yearbook and data files.
Categories, topics:
Economy & Growth, Trade
Last updated:
apr 23, 2017
Indicators value changes by year
Maximum:
44.839
jan 1, 2003
At the date of observation
Value
Absolute change
Change from previous value
jan 1, 1982
0.321
+0.321
0.0%
jan 1, 1983
0.505
+0.185
57.58%
jan 1, 1984
0.468
-0.037
-7.26%
jan 1, 1985
0.493
+0.024
5.17%
jan 1, 1986
0.504
+0.011
2.27%
jan 1, 1987
0.156
-0.347
-68.95%
jan 1, 1988
0.196
+0.04
25.54%
jan 1, 1989
0.182
-0.015
-7.54%
jan 1, 1990
0.156
-0.026
-14.28%
jan 1, 1991
0.777
+0.621
399.03%
jan 1, 1993
5.022
+4.245
546.52%
jan 1, 1994
3.737
-1.285
-25.58%
jan 1, 1995
3.728
-0.009
-0.24%
jan 1, 1996
20.44
+16.712
448.28%
jan 1, 1997
17.199
-3.242
-15.86%
jan 1, 1998
12.845
-4.354
-25.31%
jan 1, 1999
30.722
+17.877
139.18%
jan 1, 2000
28.06
-2.662
-8.67%
jan 1, 2001
31.505
+3.445
12.28%
jan 1, 2002
26.92
-4.585
-14.55%
jan 1, 2003
44.839
+17.919
66.56%
jan 1, 2004
41.813
-3.026
-6.75%
jan 1, 2005
29.34
-12.472
-29.83%
jan 1, 2006
26.412
-2.928
-9.98%
jan 1, 2007
32.856
+6.444
24.4%
jan 1, 2008
41.444
+8.588
26.14%
jan 1, 2009
34.572
-6.871
-16.58%
jan 1, 2010
36.795
+2.223
6.43%
jan 1, 2011
33.634
-3.161
-8.59%
jan 1, 2012
22.204
-11.43
-33.98%
jan 1, 2013
23.49
+1.286
5.79%
jan 1, 2014
28.433
+4.943
21.04%
jan 1, 2015
21.852
-6.581
-23.15%
jan 1, 2016
27.324
+5.472
25.04%
Ranking of countries by current statistics by years


Comments: