29
/
en
AIzaSyAYiBZKx7MnpbEhh9jyipgxe19OcubqV5w
April 1, 2024
250405
St. Kitts and Nevis
KNA
true
2
1
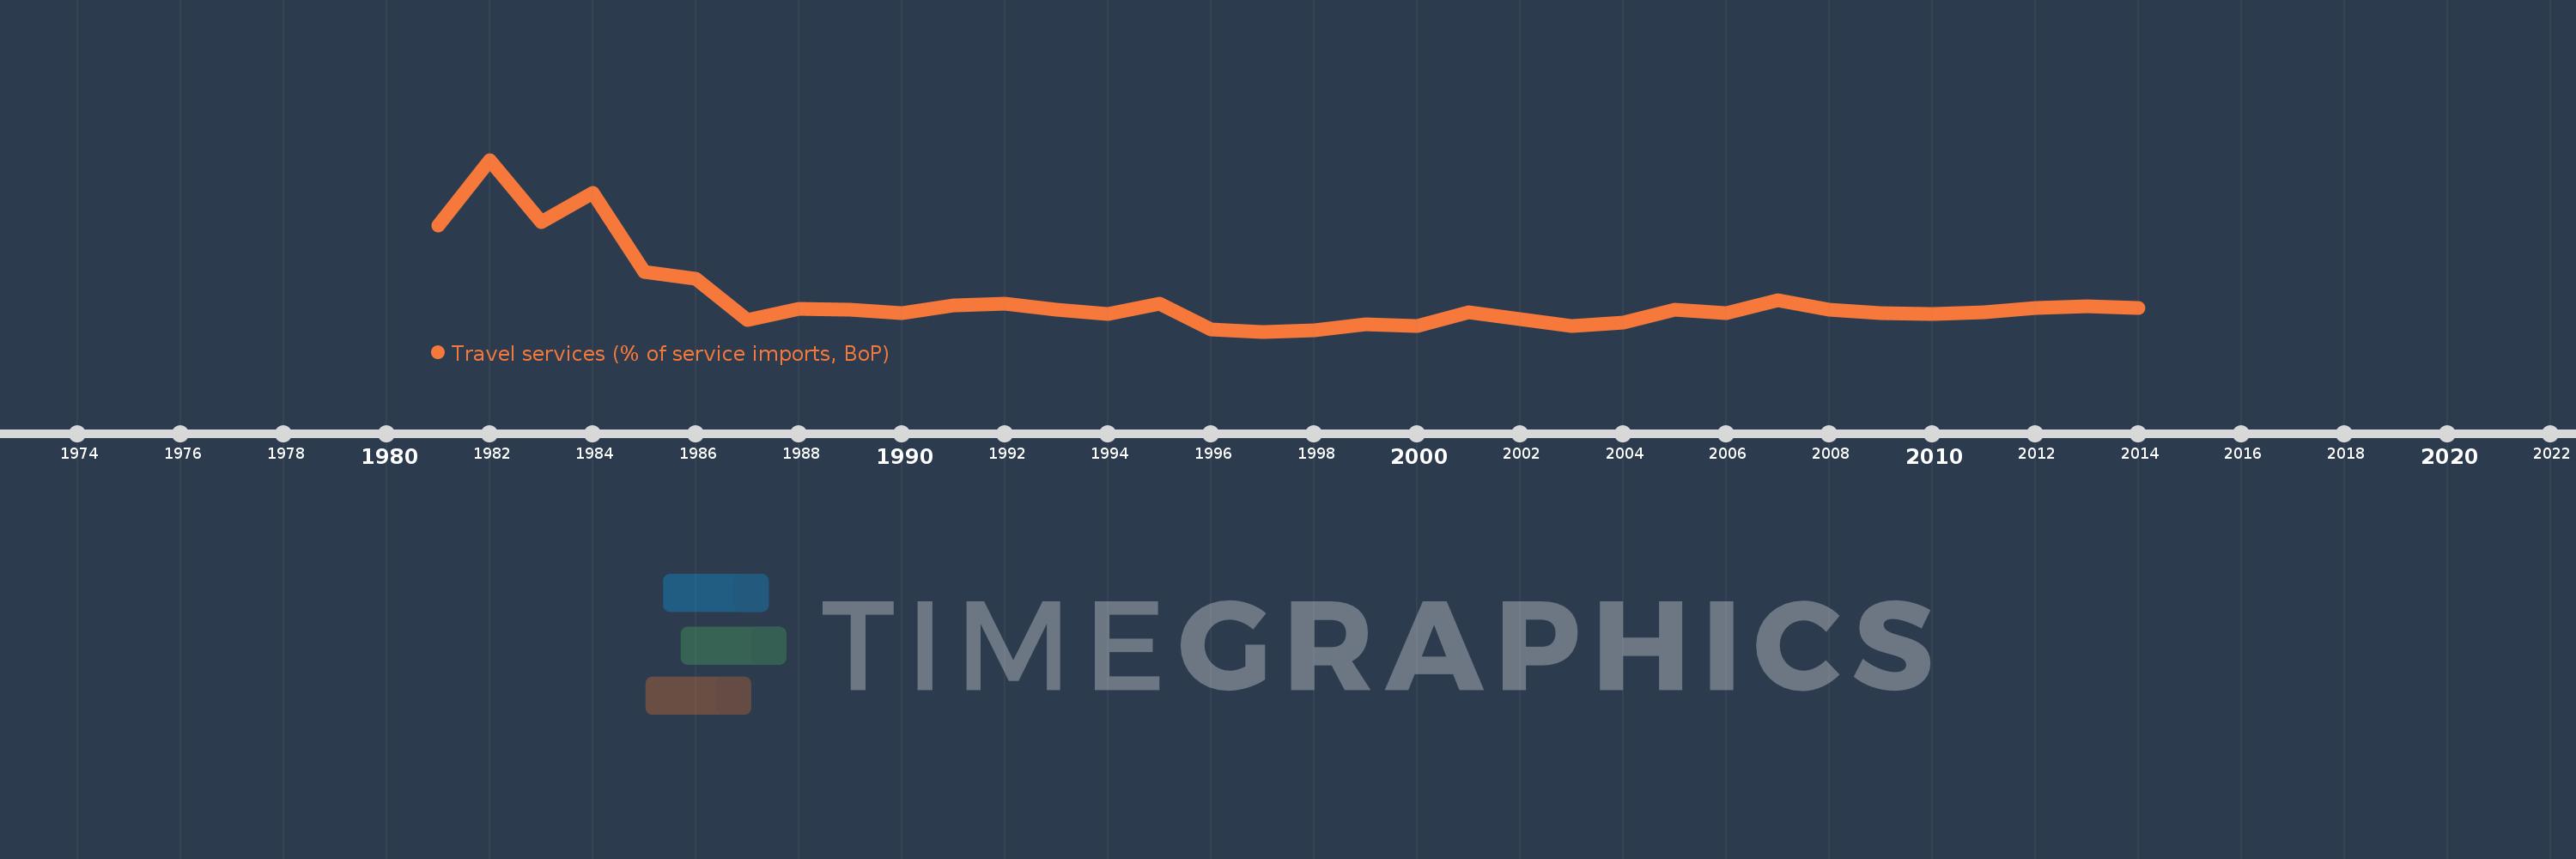
Travel services (% of service imports, BoP)
2014,2013,2012,2011,2010,2009,2008,2007,2006,2005,2004,2003,2002,2001,2000,1999,1998,1997,1996,1995,1994,1993,1992,1991,1990,1989,1988,1987,1986,1985,1984,1983,1982,1981
This statistics in other country:
AfghanistanAlbaniaAlgeriaAngolaAntigua and BarbudaArab WorldArgentinaArmeniaArubaAustraliaAustriaAzerbaijanBahamas, TheBahrainBangladeshBarbadosBelarusBelgiumBelizeBeninBermudaBhutanBoliviaBosnia and HerzegovinaBotswanaBrazilBrunei DarussalamBulgariaBurkina FasoBurundiCabo VerdeCambodiaCameroonCanadaCaribbean small statesCentral African RepublicCentral Europe and the BalticsChadChileChinaColombiaComorosCongo, Dem. Rep.Congo, Rep.Costa RicaCote d'IvoireCroatiaCuracaoCyprusCzech RepublicDenmarkDjiboutiDominicaDominican RepublicEarly-demographic dividendEast Asia & PacificEast Asia & Pacific (excluding high income)East Asia & Pacific (IDA & IBRD countries)EcuadorEgypt, Arab Rep.El SalvadorEritreaEstoniaEthiopiaEuro areaEurope & Central AsiaEurope & Central Asia (excluding high income)Europe & Central Asia (IDA & IBRD countries)European UnionFaroe IslandsFijiFinlandFragile and conflict affected situationsFranceFrench PolynesiaGabonGambia, TheGeorgiaGermanyGhanaGreeceGrenadaGuatemalaGuineaGuinea-BissauGuyanaHaitiHeavily indebted poor countries (HIPC)High incomeHondurasHong Kong SAR, ChinaHungaryIBRD onlyIcelandIDA & IBRD totalIDA onlyIDA totalIndiaIndonesiaIran, Islamic Rep.IraqIrelandIsraelItalyJamaicaJapanJordanKazakhstanKenyaKiribatiKorea, Rep.KosovoKuwaitKyrgyz RepublicLao PDRLate-demographic dividendLatin America & Caribbean Latin America & Caribbean (excluding high income)Latin America & the Caribbean (IDA & IBRD countries)LatviaLeast developed countries: UN classificationLebanonLesothoLiberiaLibyaLithuaniaLow & middle incomeLow incomeLower middle incomeLuxembourgMacao SAR, ChinaMacedonia, FYRMadagascarMalawiMalaysiaMaldivesMaliMaltaMarshall IslandsMauritaniaMauritiusMexicoMicronesia, Fed. Sts.Middle East & North AfricaMiddle East & North Africa (excluding high income)Middle East & North Africa (IDA & IBRD countries)Middle incomeMoldovaMongoliaMontenegroMoroccoMozambiqueMyanmarNamibiaNepalNetherlandsNew CaledoniaNew ZealandNicaraguaNigerNigeriaNorth AmericaNorwayOECD membersOmanOther small statesPacific island small statesPakistanPalauPanamaPapua New GuineaParaguayPeruPhilippinesPolandPortugalPost-demographic dividendPre-demographic dividendQatarRomaniaRussian FederationRwandaSamoaSao Tome and PrincipeSaudi ArabiaSenegalSerbiaSeychellesSierra LeoneSingaporeSint Maarten (Dutch part)Slovak RepublicSloveniaSmall statesSolomon IslandsSouth AfricaSouth AsiaSouth Asia (IDA & IBRD)South SudanSpainSri LankaSt. Kitts and NevisSt. LuciaSt. Vincent and the GrenadinesSub-Saharan Africa Sub-Saharan Africa (excluding high income)Sub-Saharan Africa (IDA & IBRD countries)SudanSurinameSwazilandSwedenSwitzerlandSyrian Arab RepublicTajikistanTanzaniaThailandTimor-LesteTogoTongaTrinidad and TobagoTunisiaTurkeyTuvaluUgandaUkraineUnited KingdomUnited StatesUpper middle incomeUruguayVanuatuVenezuela, RBWest Bank and GazaWorldYemen, Rep.ZambiaZimbabwe Timeline:
This timeline shows a graph from 1981 to 2014 of St. Kitts and Nevis. No data until 1980. Number of actual observations by date: 34.
Source name:
World Development Indicators
Source organization:
International Monetary Fund, Balance of Payments Statistics Yearbook and data files.
Categories, topics:
Economy & Growth, Trade
Last updated:
apr 23, 2017
Indicators value changes by year
Maximum:
33.368
jan 1, 1982
At the date of observation
Value
Absolute change
Change from previous value
jan 1, 1981
23.985
+23.985
0.0%
jan 1, 1982
33.368
+9.383
39.12%
jan 1, 1983
24.531
-8.837
-26.48%
jan 1, 1984
28.645
+4.114
16.77%
jan 1, 1985
17.447
-11.197
-39.09%
jan 1, 1986
16.475
-0.972
-5.57%
jan 1, 1987
10.567
-5.908
-35.86%
jan 1, 1988
12.117
+1.55
14.67%
jan 1, 1989
12.048
-0.069
-0.57%
jan 1, 1990
11.598
-0.45
-3.73%
jan 1, 1991
12.694
+1.095
9.44%
jan 1, 1992
12.886
+0.192
1.51%
jan 1, 1993
12.094
-0.791
-6.14%
jan 1, 1994
11.396
-0.698
-5.77%
jan 1, 1995
12.895
+1.499
13.16%
jan 1, 1996
9.282
-3.614
-28.02%
jan 1, 1997
8.916
-0.365
-3.94%
jan 1, 1998
9.071
+0.155
1.74%
jan 1, 1999
9.942
+0.871
9.6%
jan 1, 2000
9.7
-0.242
-2.44%
jan 1, 2001
11.632
+1.932
19.92%
jan 1, 2002
10.734
-0.898
-7.72%
jan 1, 2003
9.651
-1.084
-10.09%
jan 1, 2004
10.153
+0.503
5.21%
jan 1, 2005
11.974
+1.82
17.93%
jan 1, 2006
11.551
-0.423
-3.53%
jan 1, 2007
13.381
+1.83
15.84%
jan 1, 2008
12.084
-1.297
-9.69%
jan 1, 2009
11.597
-0.487
-4.03%
jan 1, 2010
11.438
-0.159
-1.38%
jan 1, 2011
11.689
+0.252
2.2%
jan 1, 2012
12.313
+0.624
5.34%
jan 1, 2013
12.467
+0.153
1.24%
jan 1, 2014
12.303
-0.163
-1.31%
Ranking of countries by current statistics by years


Comments: