29
/
en
AIzaSyAYiBZKx7MnpbEhh9jyipgxe19OcubqV5w
April 1, 2024
98090
Cabo Verde
CPV
true
2
1
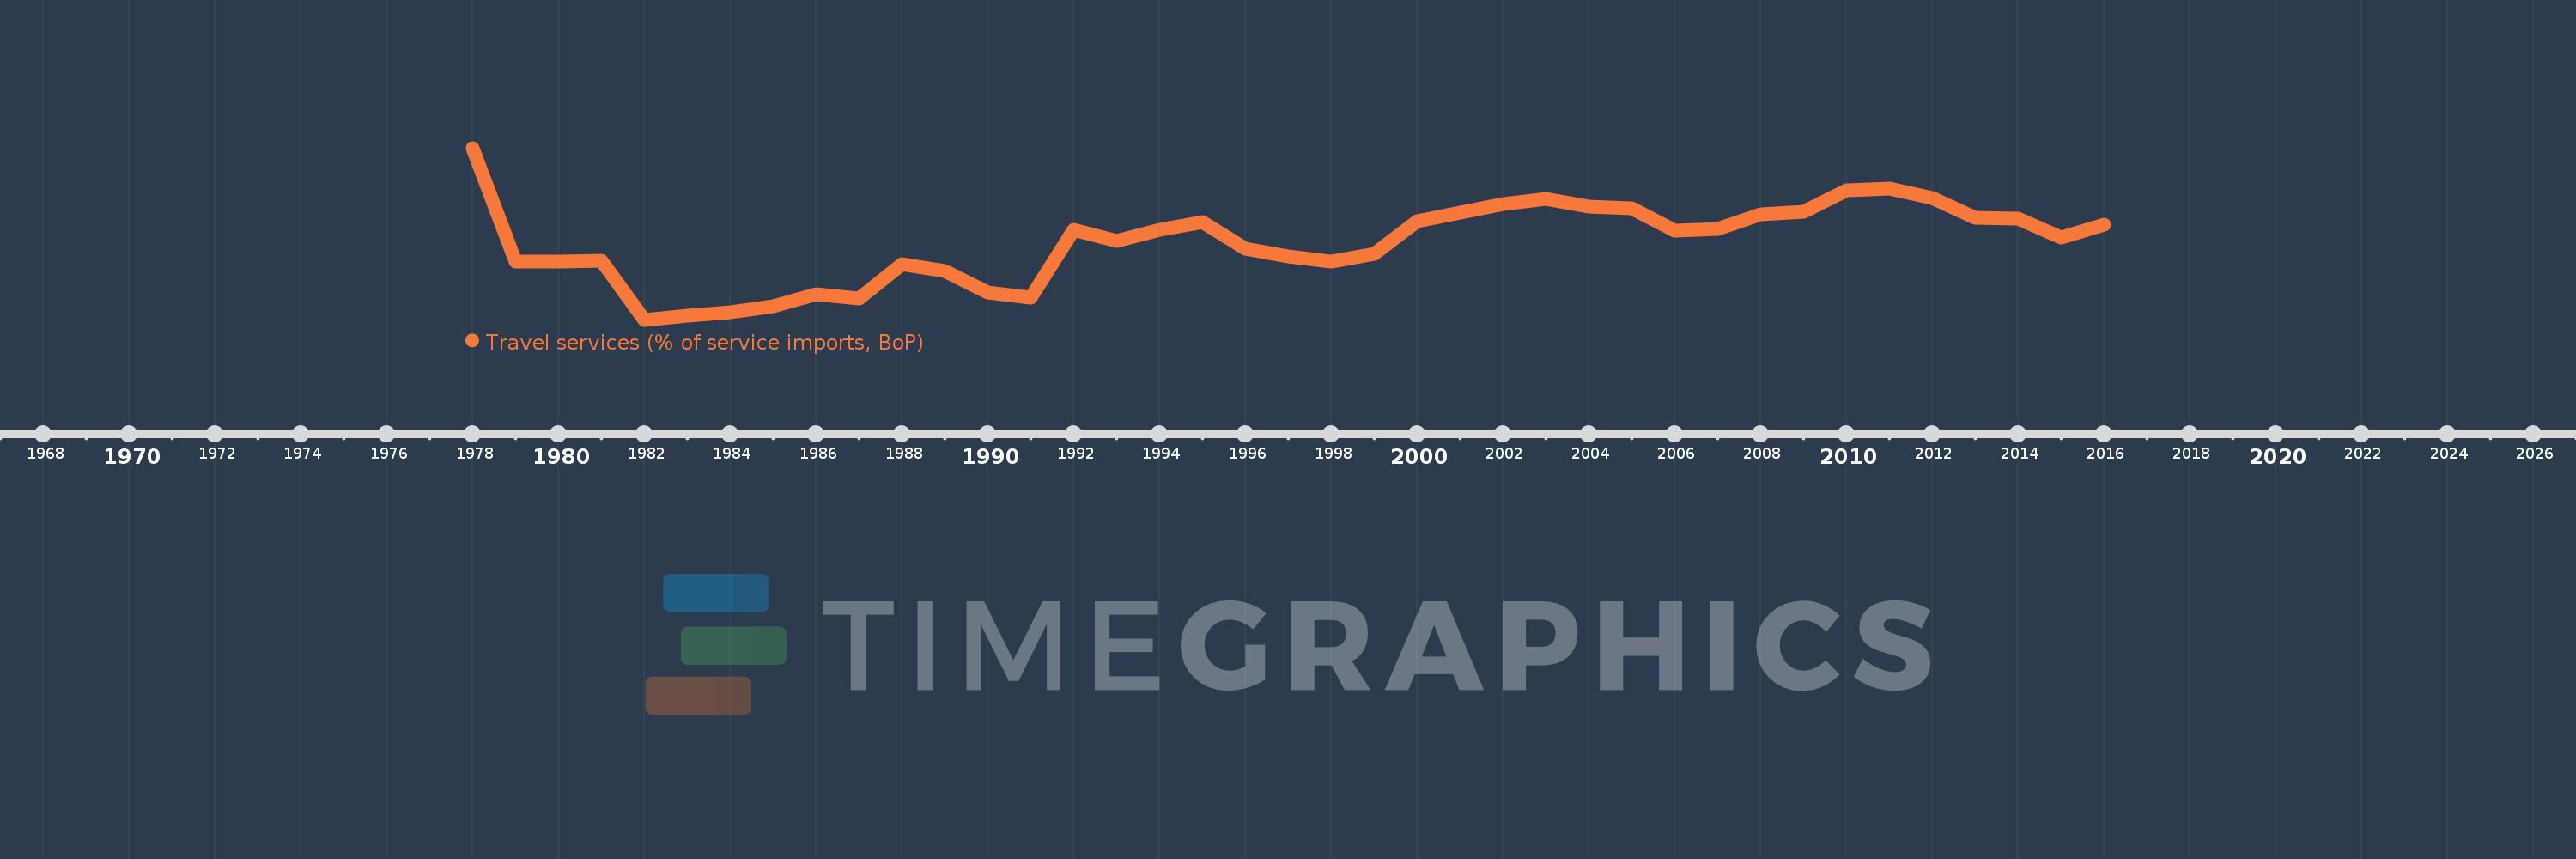
Travel services (% of service imports, BoP)
2016,2015,2014,2013,2012,2011,2010,2009,2008,2007,2006,2005,2004,2003,2002,2001,2000,1999,1998,1997,1996,1995,1994,1993,1992,1991,1990,1989,1988,1987,1986,1985,1984,1983,1982,1981,1980,1979,1978
This statistics in other country:
AfghanistanAlbaniaAlgeriaAngolaAntigua and BarbudaArab WorldArgentinaArmeniaArubaAustraliaAustriaAzerbaijanBahamas, TheBahrainBangladeshBarbadosBelarusBelgiumBelizeBeninBermudaBhutanBoliviaBosnia and HerzegovinaBotswanaBrazilBrunei DarussalamBulgariaBurkina FasoBurundiCabo VerdeCambodiaCameroonCanadaCaribbean small statesCentral African RepublicCentral Europe and the BalticsChadChileChinaColombiaComorosCongo, Dem. Rep.Congo, Rep.Costa RicaCote d'IvoireCroatiaCuracaoCyprusCzech RepublicDenmarkDjiboutiDominicaDominican RepublicEarly-demographic dividendEast Asia & PacificEast Asia & Pacific (excluding high income)East Asia & Pacific (IDA & IBRD countries)EcuadorEgypt, Arab Rep.El SalvadorEritreaEstoniaEthiopiaEuro areaEurope & Central AsiaEurope & Central Asia (excluding high income)Europe & Central Asia (IDA & IBRD countries)European UnionFaroe IslandsFijiFinlandFragile and conflict affected situationsFranceFrench PolynesiaGabonGambia, TheGeorgiaGermanyGhanaGreeceGrenadaGuatemalaGuineaGuinea-BissauGuyanaHaitiHeavily indebted poor countries (HIPC)High incomeHondurasHong Kong SAR, ChinaHungaryIBRD onlyIcelandIDA & IBRD totalIDA onlyIDA totalIndiaIndonesiaIran, Islamic Rep.IraqIrelandIsraelItalyJamaicaJapanJordanKazakhstanKenyaKiribatiKorea, Rep.KosovoKuwaitKyrgyz RepublicLao PDRLate-demographic dividendLatin America & Caribbean Latin America & Caribbean (excluding high income)Latin America & the Caribbean (IDA & IBRD countries)LatviaLeast developed countries: UN classificationLebanonLesothoLiberiaLibyaLithuaniaLow & middle incomeLow incomeLower middle incomeLuxembourgMacao SAR, ChinaMacedonia, FYRMadagascarMalawiMalaysiaMaldivesMaliMaltaMarshall IslandsMauritaniaMauritiusMexicoMicronesia, Fed. Sts.Middle East & North AfricaMiddle East & North Africa (excluding high income)Middle East & North Africa (IDA & IBRD countries)Middle incomeMoldovaMongoliaMontenegroMoroccoMozambiqueMyanmarNamibiaNepalNetherlandsNew CaledoniaNew ZealandNicaraguaNigerNigeriaNorth AmericaNorwayOECD membersOmanOther small statesPacific island small statesPakistanPalauPanamaPapua New GuineaParaguayPeruPhilippinesPolandPortugalPost-demographic dividendPre-demographic dividendQatarRomaniaRussian FederationRwandaSamoaSao Tome and PrincipeSaudi ArabiaSenegalSerbiaSeychellesSierra LeoneSingaporeSint Maarten (Dutch part)Slovak RepublicSloveniaSmall statesSolomon IslandsSouth AfricaSouth AsiaSouth Asia (IDA & IBRD)South SudanSpainSri LankaSt. Kitts and NevisSt. LuciaSt. Vincent and the GrenadinesSub-Saharan Africa Sub-Saharan Africa (excluding high income)Sub-Saharan Africa (IDA & IBRD countries)SudanSurinameSwazilandSwedenSwitzerlandSyrian Arab RepublicTajikistanTanzaniaThailandTimor-LesteTogoTongaTrinidad and TobagoTunisiaTurkeyTuvaluUgandaUkraineUnited KingdomUnited StatesUpper middle incomeUruguayVanuatuVenezuela, RBWest Bank and GazaWorldYemen, Rep.ZambiaZimbabwe Timeline:
This timeline shows a graph from 1978 to 2016 of Cabo Verde. No data until 1977. Number of actual observations by date: 39.
Source name:
World Development Indicators
Source organization:
International Monetary Fund, Balance of Payments Statistics Yearbook and data files.
Categories, topics:
Economy & Growth, Trade
Last updated:
apr 23, 2017
Indicators value changes by year
Maximum:
52.369
jan 1, 1978
At the date of observation
Value
Absolute change
Change from previous value
jan 1, 1978
52.369
+52.369
0.0%
jan 1, 1979
23.476
-28.894
-55.17%
jan 1, 1980
23.598
+0.123
0.52%
jan 1, 1981
23.659
+0.061
0.26%
jan 1, 1982
8.756
-14.903
-62.99%
jan 1, 1983
9.706
+0.95
10.85%
jan 1, 1984
10.597
+0.89
9.17%
jan 1, 1985
12.218
+1.622
15.3%
jan 1, 1986
15.268
+3.05
24.96%
jan 1, 1987
14.065
-1.204
-7.88%
jan 1, 1988
22.904
+8.839
62.84%
jan 1, 1989
21.143
-1.761
-7.69%
jan 1, 1990
15.592
-5.551
-26.26%
jan 1, 1991
14.268
-1.324
-8.49%
jan 1, 1992
31.638
+17.37
121.75%
jan 1, 1993
28.735
-2.903
-9.18%
jan 1, 1994
31.651
+2.917
10.15%
jan 1, 1995
33.589
+1.937
6.12%
jan 1, 1996
26.753
-6.836
-20.35%
jan 1, 1997
24.782
-1.97
-7.37%
jan 1, 1998
23.502
-1.28
-5.17%
jan 1, 1999
25.466
+1.964
8.36%
jan 1, 2000
33.68
+8.214
32.25%
jan 1, 2001
35.925
+2.245
6.67%
jan 1, 2002
38.224
+2.298
6.4%
jan 1, 2003
39.335
+1.111
2.91%
jan 1, 2004
37.528
-1.807
-4.59%
jan 1, 2005
37.127
-0.401
-1.07%
jan 1, 2006
31.325
-5.802
-15.63%
jan 1, 2007
31.801
+0.475
1.52%
jan 1, 2008
35.463
+3.663
11.52%
jan 1, 2009
36.214
+0.751
2.12%
jan 1, 2010
41.59
+5.376
14.85%
jan 1, 2011
42.016
+0.425
1.02%
jan 1, 2012
39.689
-2.326
-5.54%
jan 1, 2013
34.582
-5.108
-12.87%
jan 1, 2014
34.449
-0.133
-0.38%
jan 1, 2015
29.695
-4.754
-13.8%
jan 1, 2016
32.965
+3.27
11.01%
Ranking of countries by current statistics by years


Comments: