29
/
en
AIzaSyAYiBZKx7MnpbEhh9jyipgxe19OcubqV5w
April 1, 2024
213783
Nigeria
NGA
true
2
1
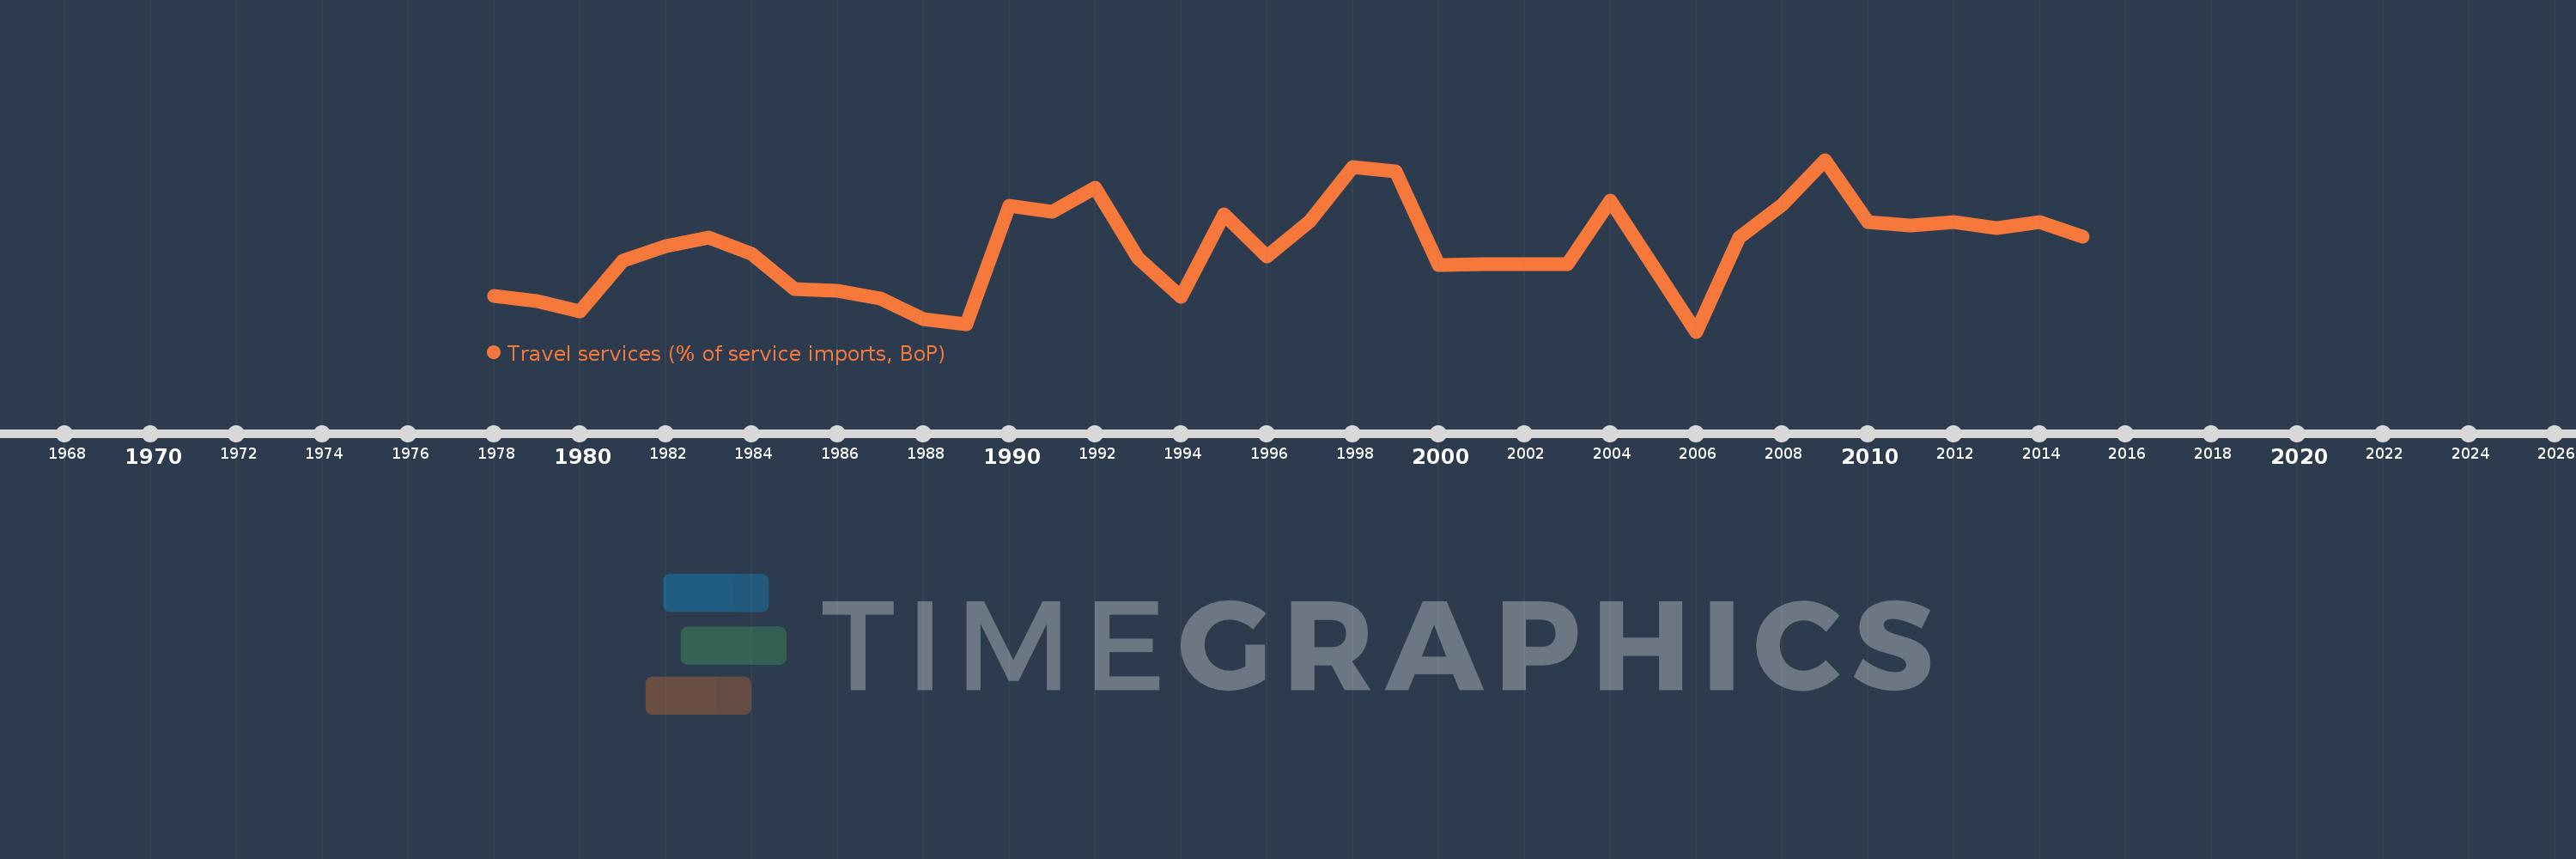
Travel services (% of service imports, BoP)
2015,2014,2013,2012,2011,2010,2009,2008,2007,2006,2004,2003,2002,2001,2000,1999,1998,1997,1996,1995,1994,1993,1992,1991,1990,1989,1988,1987,1986,1985,1984,1983,1982,1981,1980,1979,1978
This statistics in other country:
AfghanistanAlbaniaAlgeriaAngolaAntigua and BarbudaArab WorldArgentinaArmeniaArubaAustraliaAustriaAzerbaijanBahamas, TheBahrainBangladeshBarbadosBelarusBelgiumBelizeBeninBermudaBhutanBoliviaBosnia and HerzegovinaBotswanaBrazilBrunei DarussalamBulgariaBurkina FasoBurundiCabo VerdeCambodiaCameroonCanadaCaribbean small statesCentral African RepublicCentral Europe and the BalticsChadChileChinaColombiaComorosCongo, Dem. Rep.Congo, Rep.Costa RicaCote d'IvoireCroatiaCuracaoCyprusCzech RepublicDenmarkDjiboutiDominicaDominican RepublicEarly-demographic dividendEast Asia & PacificEast Asia & Pacific (excluding high income)East Asia & Pacific (IDA & IBRD countries)EcuadorEgypt, Arab Rep.El SalvadorEritreaEstoniaEthiopiaEuro areaEurope & Central AsiaEurope & Central Asia (excluding high income)Europe & Central Asia (IDA & IBRD countries)European UnionFaroe IslandsFijiFinlandFragile and conflict affected situationsFranceFrench PolynesiaGabonGambia, TheGeorgiaGermanyGhanaGreeceGrenadaGuatemalaGuineaGuinea-BissauGuyanaHaitiHeavily indebted poor countries (HIPC)High incomeHondurasHong Kong SAR, ChinaHungaryIBRD onlyIcelandIDA & IBRD totalIDA onlyIDA totalIndiaIndonesiaIran, Islamic Rep.IraqIrelandIsraelItalyJamaicaJapanJordanKazakhstanKenyaKiribatiKorea, Rep.KosovoKuwaitKyrgyz RepublicLao PDRLate-demographic dividendLatin America & Caribbean Latin America & Caribbean (excluding high income)Latin America & the Caribbean (IDA & IBRD countries)LatviaLeast developed countries: UN classificationLebanonLesothoLiberiaLibyaLithuaniaLow & middle incomeLow incomeLower middle incomeLuxembourgMacao SAR, ChinaMacedonia, FYRMadagascarMalawiMalaysiaMaldivesMaliMaltaMarshall IslandsMauritaniaMauritiusMexicoMicronesia, Fed. Sts.Middle East & North AfricaMiddle East & North Africa (excluding high income)Middle East & North Africa (IDA & IBRD countries)Middle incomeMoldovaMongoliaMontenegroMoroccoMozambiqueMyanmarNamibiaNepalNetherlandsNew CaledoniaNew ZealandNicaraguaNigerNigeriaNorth AmericaNorwayOECD membersOmanOther small statesPacific island small statesPakistanPalauPanamaPapua New GuineaParaguayPeruPhilippinesPolandPortugalPost-demographic dividendPre-demographic dividendQatarRomaniaRussian FederationRwandaSamoaSao Tome and PrincipeSaudi ArabiaSenegalSerbiaSeychellesSierra LeoneSingaporeSint Maarten (Dutch part)Slovak RepublicSloveniaSmall statesSolomon IslandsSouth AfricaSouth AsiaSouth Asia (IDA & IBRD)South SudanSpainSri LankaSt. Kitts and NevisSt. LuciaSt. Vincent and the GrenadinesSub-Saharan Africa Sub-Saharan Africa (excluding high income)Sub-Saharan Africa (IDA & IBRD countries)SudanSurinameSwazilandSwedenSwitzerlandSyrian Arab RepublicTajikistanTanzaniaThailandTimor-LesteTogoTongaTrinidad and TobagoTunisiaTurkeyTuvaluUgandaUkraineUnited KingdomUnited StatesUpper middle incomeUruguayVanuatuVenezuela, RBWest Bank and GazaWorldYemen, Rep.ZambiaZimbabwe Timeline:
This timeline shows a graph from 1978 to 2015 of Nigeria. No data until 1977. Number of actual observations by date: 37.
Source name:
World Development Indicators
Source organization:
International Monetary Fund, Balance of Payments Statistics Yearbook and data files.
Categories, topics:
Economy & Growth, Trade
Last updated:
apr 23, 2017
Indicators value changes by year
Maximum:
40.115
jan 1, 2009
At the date of observation
Value
Absolute change
Change from previous value
jan 1, 1978
11.223
+11.223
0.0%
jan 1, 1979
10.133
-1.09
-9.71%
jan 1, 1980
7.859
-2.273
-22.44%
jan 1, 1981
18.685
+10.826
137.75%
jan 1, 1982
21.843
+3.158
16.9%
jan 1, 1983
23.654
+1.811
8.29%
jan 1, 1984
20.151
-3.503
-14.81%
jan 1, 1985
12.69
-7.46
-37.02%
jan 1, 1986
12.365
-0.325
-2.56%
jan 1, 1987
10.613
-1.752
-14.17%
jan 1, 1988
6.312
-4.301
-40.52%
jan 1, 1989
5.181
-1.132
-17.93%
jan 1, 1990
30.307
+25.126
484.98%
jan 1, 1991
29.163
-1.144
-3.77%
jan 1, 1992
34.253
+5.089
17.45%
jan 1, 1993
19.23
-15.022
-43.86%
jan 1, 1994
10.927
-8.303
-43.18%
jan 1, 1995
28.536
+17.609
161.15%
jan 1, 1996
19.624
-8.912
-31.23%
jan 1, 1997
27.015
+7.391
37.66%
jan 1, 1998
38.532
+11.517
42.63%
jan 1, 1999
37.627
-0.905
-2.35%
jan 1, 2000
17.85
-19.776
-52.56%
jan 1, 2001
17.9
+0.05
0.28%
jan 1, 2002
17.9
+0.0
0.0%
jan 1, 2003
17.9
+0.0
0.0%
jan 1, 2004
31.404
+13.504
75.44%
jan 1, 2006
3.618
-27.787
-88.48%
jan 1, 2007
23.55
+19.932
550.96%
jan 1, 2008
30.466
+6.916
29.37%
jan 1, 2009
40.115
+9.649
31.67%
jan 1, 2010
26.807
-13.308
-33.17%
jan 1, 2011
26.093
-0.714
-2.66%
jan 1, 2012
26.855
+0.761
2.92%
jan 1, 2013
25.651
-1.203
-4.48%
jan 1, 2014
26.895
+1.244
4.85%
jan 1, 2015
23.761
-3.134
-11.65%
Ranking of countries by current statistics by years


Comments: