29
/
en
AIzaSyAYiBZKx7MnpbEhh9jyipgxe19OcubqV5w
April 1, 2024
257898
Switzerland
CHE
true
2
1
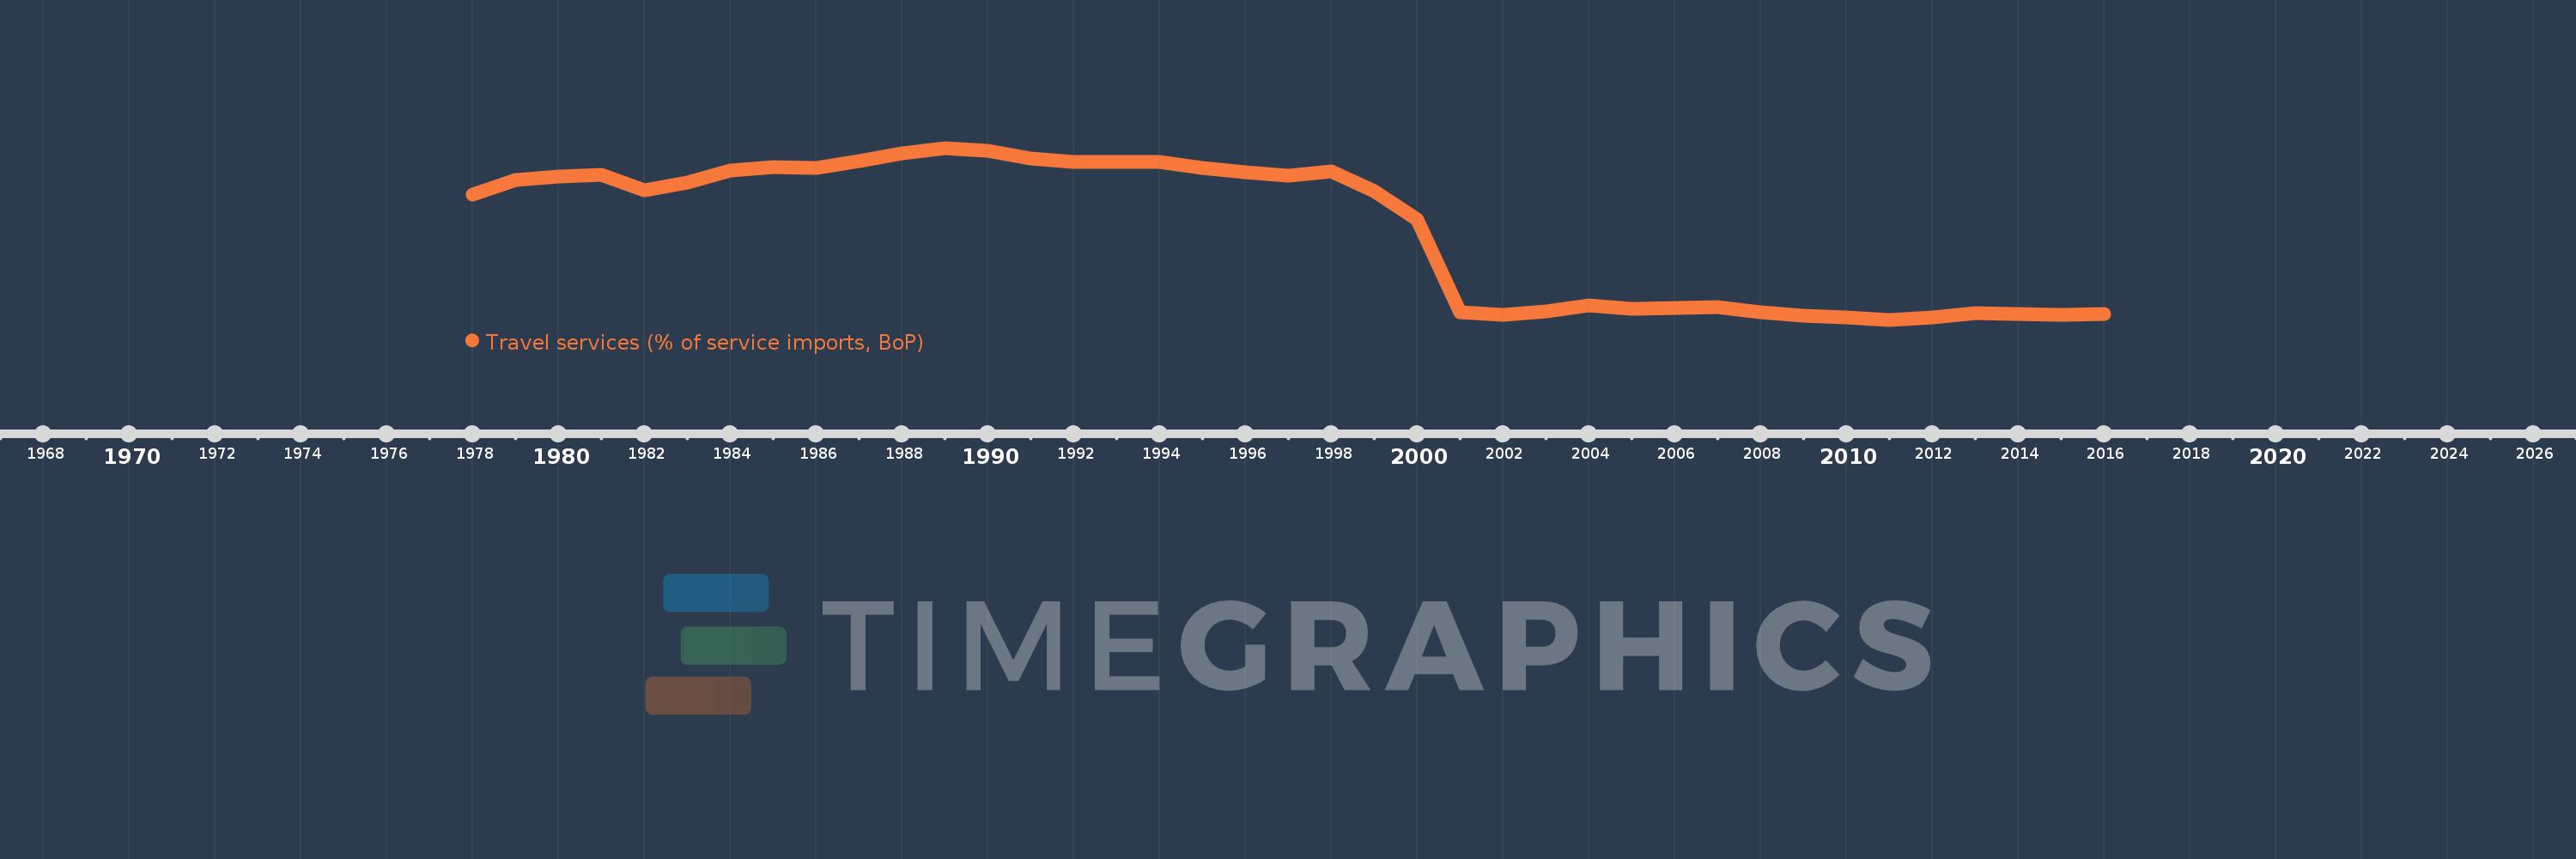
Travel services (% of service imports, BoP)
2016,2015,2014,2013,2012,2011,2010,2009,2008,2007,2006,2005,2004,2003,2002,2001,2000,1999,1998,1997,1996,1995,1994,1993,1992,1991,1990,1989,1988,1987,1986,1985,1984,1983,1982,1981,1980,1979,1978
This statistics in other country:
AfghanistanAlbaniaAlgeriaAngolaAntigua and BarbudaArab WorldArgentinaArmeniaArubaAustraliaAustriaAzerbaijanBahamas, TheBahrainBangladeshBarbadosBelarusBelgiumBelizeBeninBermudaBhutanBoliviaBosnia and HerzegovinaBotswanaBrazilBrunei DarussalamBulgariaBurkina FasoBurundiCabo VerdeCambodiaCameroonCanadaCaribbean small statesCentral African RepublicCentral Europe and the BalticsChadChileChinaColombiaComorosCongo, Dem. Rep.Congo, Rep.Costa RicaCote d'IvoireCroatiaCuracaoCyprusCzech RepublicDenmarkDjiboutiDominicaDominican RepublicEarly-demographic dividendEast Asia & PacificEast Asia & Pacific (excluding high income)East Asia & Pacific (IDA & IBRD countries)EcuadorEgypt, Arab Rep.El SalvadorEritreaEstoniaEthiopiaEuro areaEurope & Central AsiaEurope & Central Asia (excluding high income)Europe & Central Asia (IDA & IBRD countries)European UnionFaroe IslandsFijiFinlandFragile and conflict affected situationsFranceFrench PolynesiaGabonGambia, TheGeorgiaGermanyGhanaGreeceGrenadaGuatemalaGuineaGuinea-BissauGuyanaHaitiHeavily indebted poor countries (HIPC)High incomeHondurasHong Kong SAR, ChinaHungaryIBRD onlyIcelandIDA & IBRD totalIDA onlyIDA totalIndiaIndonesiaIran, Islamic Rep.IraqIrelandIsraelItalyJamaicaJapanJordanKazakhstanKenyaKiribatiKorea, Rep.KosovoKuwaitKyrgyz RepublicLao PDRLate-demographic dividendLatin America & Caribbean Latin America & Caribbean (excluding high income)Latin America & the Caribbean (IDA & IBRD countries)LatviaLeast developed countries: UN classificationLebanonLesothoLiberiaLibyaLithuaniaLow & middle incomeLow incomeLower middle incomeLuxembourgMacao SAR, ChinaMacedonia, FYRMadagascarMalawiMalaysiaMaldivesMaliMaltaMarshall IslandsMauritaniaMauritiusMexicoMicronesia, Fed. Sts.Middle East & North AfricaMiddle East & North Africa (excluding high income)Middle East & North Africa (IDA & IBRD countries)Middle incomeMoldovaMongoliaMontenegroMoroccoMozambiqueMyanmarNamibiaNepalNetherlandsNew CaledoniaNew ZealandNicaraguaNigerNigeriaNorth AmericaNorwayOECD membersOmanOther small statesPacific island small statesPakistanPalauPanamaPapua New GuineaParaguayPeruPhilippinesPolandPortugalPost-demographic dividendPre-demographic dividendQatarRomaniaRussian FederationRwandaSamoaSao Tome and PrincipeSaudi ArabiaSenegalSerbiaSeychellesSierra LeoneSingaporeSint Maarten (Dutch part)Slovak RepublicSloveniaSmall statesSolomon IslandsSouth AfricaSouth AsiaSouth Asia (IDA & IBRD)South SudanSpainSri LankaSt. Kitts and NevisSt. LuciaSt. Vincent and the GrenadinesSub-Saharan Africa Sub-Saharan Africa (excluding high income)Sub-Saharan Africa (IDA & IBRD countries)SudanSurinameSwazilandSwedenSwitzerlandSyrian Arab RepublicTajikistanTanzaniaThailandTimor-LesteTogoTongaTrinidad and TobagoTunisiaTurkeyTuvaluUgandaUkraineUnited KingdomUnited StatesUpper middle incomeUruguayVanuatuVenezuela, RBWest Bank and GazaWorldYemen, Rep.ZambiaZimbabwe Timeline:
This timeline shows a graph from 1978 to 2016 of Switzerland. No data until 1977. Number of actual observations by date: 39.
Source name:
World Development Indicators
Source organization:
International Monetary Fund, Balance of Payments Statistics Yearbook and data files.
Categories, topics:
Economy & Growth, Trade
Last updated:
apr 23, 2017
Indicators value changes by year
Minimum:
16.097
jan 1, 2011
Maximum:
54.833
jan 1, 1989
At the date of observation
Value
Absolute change
Change from previous value
jan 1, 1978
44.334
+44.334
0.0%
jan 1, 1979
47.63
+3.296
7.44%
jan 1, 1980
48.428
+0.798
1.68%
jan 1, 1981
48.753
+0.325
0.67%
jan 1, 1982
45.282
-3.471
-7.12%
jan 1, 1983
46.997
+1.715
3.79%
jan 1, 1984
49.799
+2.802
5.96%
jan 1, 1985
50.602
+0.803
1.61%
jan 1, 1986
50.328
-0.274
-0.54%
jan 1, 1987
51.889
+1.561
3.1%
jan 1, 1988
53.639
+1.749
3.37%
jan 1, 1989
54.833
+1.194
2.23%
jan 1, 1990
54.139
-0.694
-1.27%
jan 1, 1991
52.435
-1.704
-3.15%
jan 1, 1992
51.65
-0.785
-1.5%
jan 1, 1993
51.699
+0.049
0.09%
jan 1, 1994
51.711
+0.012
0.02%
jan 1, 1995
50.26
-1.451
-2.81%
jan 1, 1996
49.344
-0.916
-1.82%
jan 1, 1997
48.597
-0.747
-1.51%
jan 1, 1998
49.555
+0.958
1.97%
jan 1, 1999
45.17
-4.385
-8.85%
jan 1, 2000
38.749
-6.42
-14.21%
jan 1, 2001
17.719
-21.03
-54.27%
jan 1, 2002
17.203
-0.517
-2.92%
jan 1, 2003
17.911
+0.709
4.12%
jan 1, 2004
19.379
+1.468
8.19%
jan 1, 2005
18.64
-0.739
-3.81%
jan 1, 2006
18.827
+0.187
1.0%
jan 1, 2007
18.91
+0.084
0.44%
jan 1, 2008
17.87
-1.041
-5.5%
jan 1, 2009
17.069
-0.801
-4.48%
jan 1, 2010
16.688
-0.381
-2.23%
jan 1, 2011
16.097
-0.591
-3.54%
jan 1, 2012
16.57
+0.472
2.93%
jan 1, 2013
17.616
+1.046
6.31%
jan 1, 2014
17.47
-0.145
-0.83%
jan 1, 2015
17.157
-0.314
-1.79%
jan 1, 2016
17.32
+0.163
0.95%
Ranking of countries by current statistics by years


Comments: