29
/
en
AIzaSyAYiBZKx7MnpbEhh9jyipgxe19OcubqV5w
April 1, 2024
25403
Caribbean small states
CSS
false
2
1
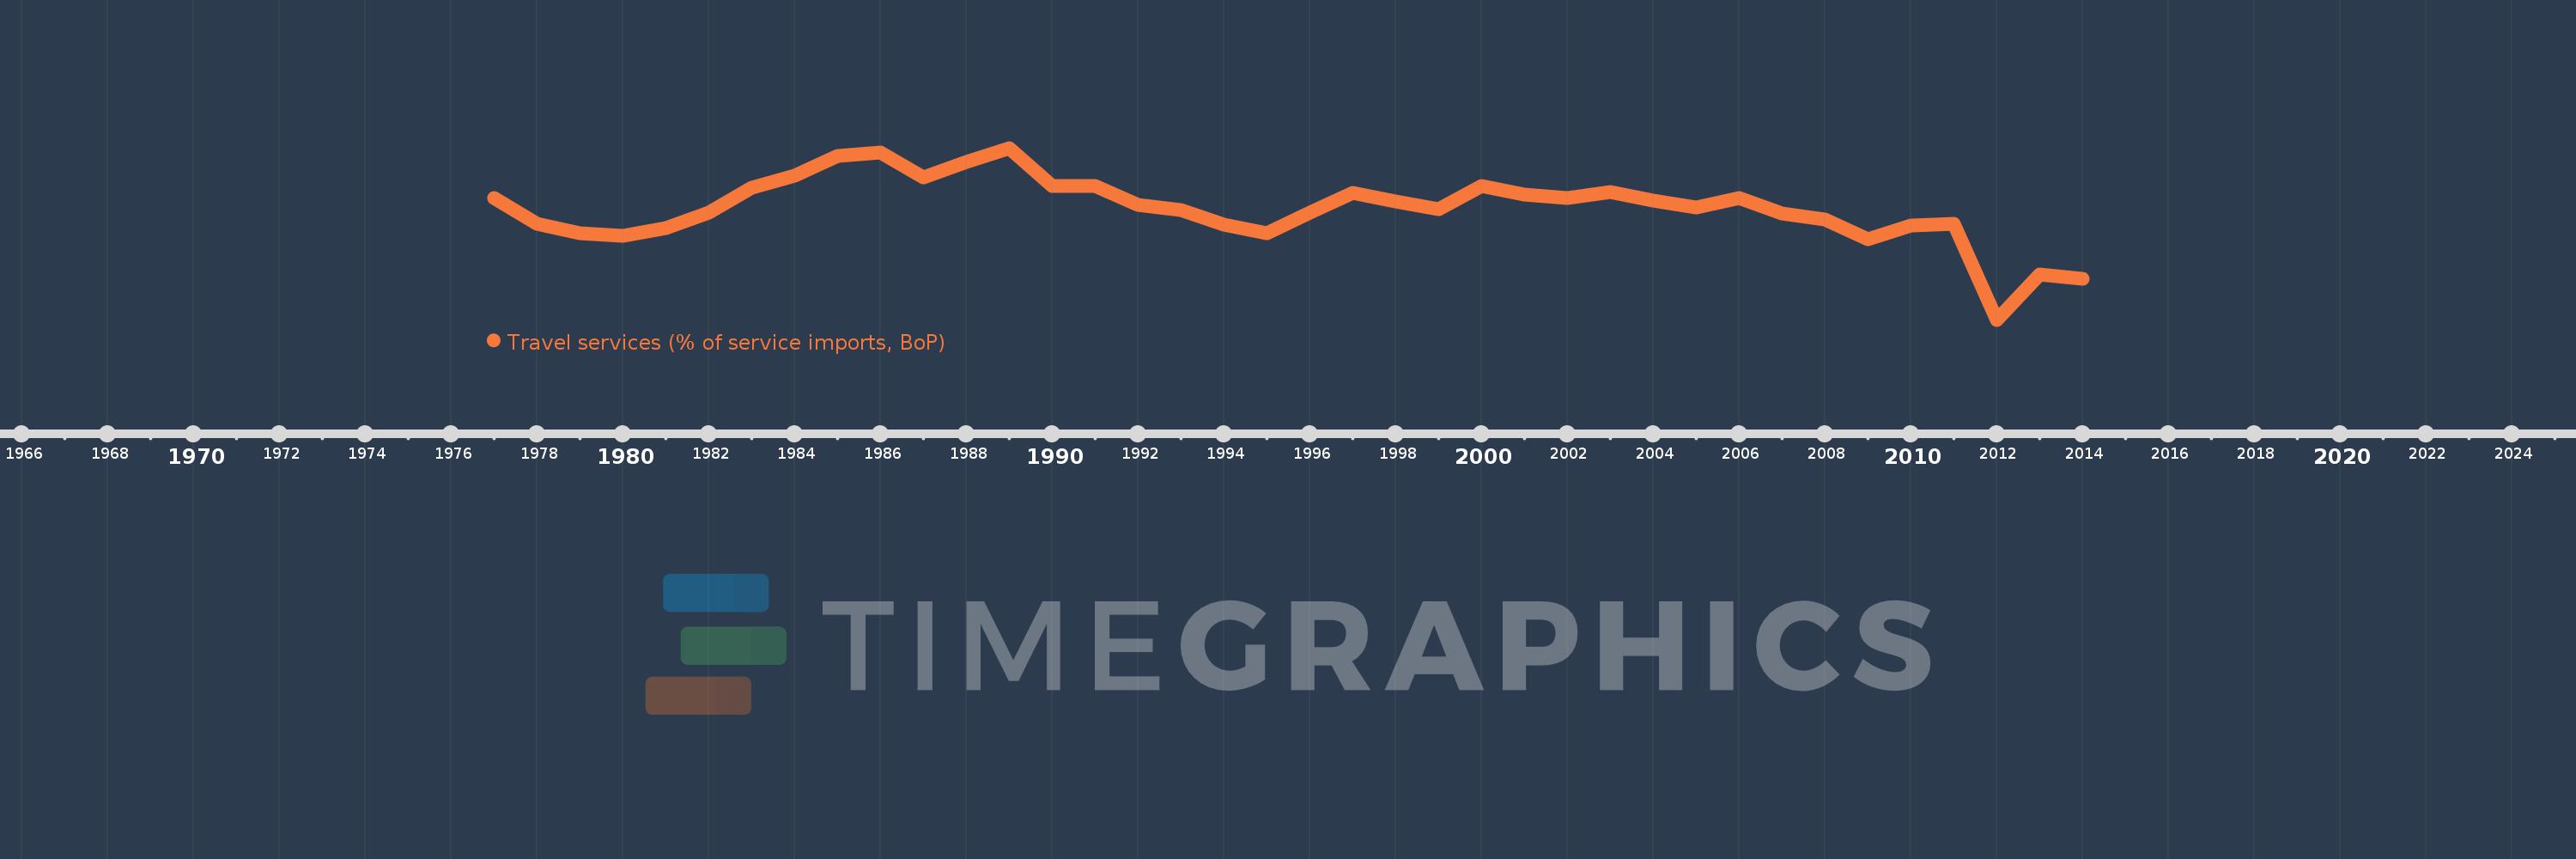
Travel services (% of service imports, BoP)
2014,2013,2012,2011,2010,2009,2008,2007,2006,2005,2004,2003,2002,2001,2000,1999,1998,1997,1996,1995,1994,1993,1992,1991,1990,1989,1988,1987,1986,1985,1984,1983,1982,1981,1980,1979,1978,1977
This statistics in other country:
AfghanistanAlbaniaAlgeriaAngolaAntigua and BarbudaArab WorldArgentinaArmeniaArubaAustraliaAustriaAzerbaijanBahamas, TheBahrainBangladeshBarbadosBelarusBelgiumBelizeBeninBermudaBhutanBoliviaBosnia and HerzegovinaBotswanaBrazilBrunei DarussalamBulgariaBurkina FasoBurundiCabo VerdeCambodiaCameroonCanadaCaribbean small statesCentral African RepublicCentral Europe and the BalticsChadChileChinaColombiaComorosCongo, Dem. Rep.Congo, Rep.Costa RicaCote d'IvoireCroatiaCuracaoCyprusCzech RepublicDenmarkDjiboutiDominicaDominican RepublicEarly-demographic dividendEast Asia & PacificEast Asia & Pacific (excluding high income)East Asia & Pacific (IDA & IBRD countries)EcuadorEgypt, Arab Rep.El SalvadorEritreaEstoniaEthiopiaEuro areaEurope & Central AsiaEurope & Central Asia (excluding high income)Europe & Central Asia (IDA & IBRD countries)European UnionFaroe IslandsFijiFinlandFragile and conflict affected situationsFranceFrench PolynesiaGabonGambia, TheGeorgiaGermanyGhanaGreeceGrenadaGuatemalaGuineaGuinea-BissauGuyanaHaitiHeavily indebted poor countries (HIPC)High incomeHondurasHong Kong SAR, ChinaHungaryIBRD onlyIcelandIDA & IBRD totalIDA onlyIDA totalIndiaIndonesiaIran, Islamic Rep.IraqIrelandIsraelItalyJamaicaJapanJordanKazakhstanKenyaKiribatiKorea, Rep.KosovoKuwaitKyrgyz RepublicLao PDRLate-demographic dividendLatin America & Caribbean Latin America & Caribbean (excluding high income)Latin America & the Caribbean (IDA & IBRD countries)LatviaLeast developed countries: UN classificationLebanonLesothoLiberiaLibyaLithuaniaLow & middle incomeLow incomeLower middle incomeLuxembourgMacao SAR, ChinaMacedonia, FYRMadagascarMalawiMalaysiaMaldivesMaliMaltaMarshall IslandsMauritaniaMauritiusMexicoMicronesia, Fed. Sts.Middle East & North AfricaMiddle East & North Africa (excluding high income)Middle East & North Africa (IDA & IBRD countries)Middle incomeMoldovaMongoliaMontenegroMoroccoMozambiqueMyanmarNamibiaNepalNetherlandsNew CaledoniaNew ZealandNicaraguaNigerNigeriaNorth AmericaNorwayOECD membersOmanOther small statesPacific island small statesPakistanPalauPanamaPapua New GuineaParaguayPeruPhilippinesPolandPortugalPost-demographic dividendPre-demographic dividendQatarRomaniaRussian FederationRwandaSamoaSao Tome and PrincipeSaudi ArabiaSenegalSerbiaSeychellesSierra LeoneSingaporeSint Maarten (Dutch part)Slovak RepublicSloveniaSmall statesSolomon IslandsSouth AfricaSouth AsiaSouth Asia (IDA & IBRD)South SudanSpainSri LankaSt. Kitts and NevisSt. LuciaSt. Vincent and the GrenadinesSub-Saharan Africa Sub-Saharan Africa (excluding high income)Sub-Saharan Africa (IDA & IBRD countries)SudanSurinameSwazilandSwedenSwitzerlandSyrian Arab RepublicTajikistanTanzaniaThailandTimor-LesteTogoTongaTrinidad and TobagoTunisiaTurkeyTuvaluUgandaUkraineUnited KingdomUnited StatesUpper middle incomeUruguayVanuatuVenezuela, RBWest Bank and GazaWorldYemen, Rep.ZambiaZimbabwe Timeline:
This timeline shows a graph from 1977 to 2014 of Caribbean small states. No data until 1976. Number of actual observations by date: 38.
Source name:
World Development Indicators
Source organization:
International Monetary Fund, Balance of Payments Statistics Yearbook and data files.
Categories, topics:
Economy & Growth, Trade
Last updated:
apr 23, 2017
Indicators value changes by year
Maximum:
26.899
jan 1, 1989
At the date of observation
Value
Absolute change
Change from previous value
jan 1, 1977
21.538
+21.538
0.0%
jan 1, 1978
18.681
-2.857
-13.26%
jan 1, 1979
17.669
-1.012
-5.42%
jan 1, 1980
17.424
-0.245
-1.38%
jan 1, 1981
18.236
+0.812
4.66%
jan 1, 1982
19.966
+1.73
9.48%
jan 1, 1983
22.657
+2.691
13.48%
jan 1, 1984
23.905
+1.248
5.51%
jan 1, 1985
25.992
+2.087
8.73%
jan 1, 1986
26.409
+0.417
1.6%
jan 1, 1987
23.764
-2.646
-10.02%
jan 1, 1988
25.407
+1.643
6.92%
jan 1, 1989
26.899
+1.492
5.87%
jan 1, 1990
22.811
-4.088
-15.2%
jan 1, 1991
22.774
-0.037
-0.16%
jan 1, 1992
20.769
-2.005
-8.8%
jan 1, 1993
20.158
-0.612
-2.95%
jan 1, 1994
18.625
-1.533
-7.61%
jan 1, 1995
17.726
-0.899
-4.83%
jan 1, 1996
19.907
+2.182
12.31%
jan 1, 1997
22.034
+2.127
10.68%
jan 1, 1998
21.093
-0.941
-4.27%
jan 1, 1999
20.332
-0.761
-3.61%
jan 1, 2000
22.773
+2.441
12.01%
jan 1, 2001
21.89
-0.884
-3.88%
jan 1, 2002
21.509
-0.381
-1.74%
jan 1, 2003
22.17
+0.662
3.08%
jan 1, 2004
21.182
-0.988
-4.45%
jan 1, 2005
20.447
-0.736
-3.47%
jan 1, 2006
21.49
+1.043
5.1%
jan 1, 2007
19.874
-1.616
-7.52%
jan 1, 2008
19.173
-0.701
-3.53%
jan 1, 2009
17.017
-2.156
-11.24%
jan 1, 2010
18.57
+1.553
9.13%
jan 1, 2011
18.699
+0.128
0.69%
jan 1, 2012
8.376
-10.322
-55.2%
jan 1, 2013
13.212
+4.835
57.73%
jan 1, 2014
12.751
-0.461
-3.49%
Ranking of countries by current statistics by years


Comments: