29
/
en
AIzaSyAYiBZKx7MnpbEhh9jyipgxe19OcubqV5w
April 1, 2024
133735
Finland
FIN
true
2
1
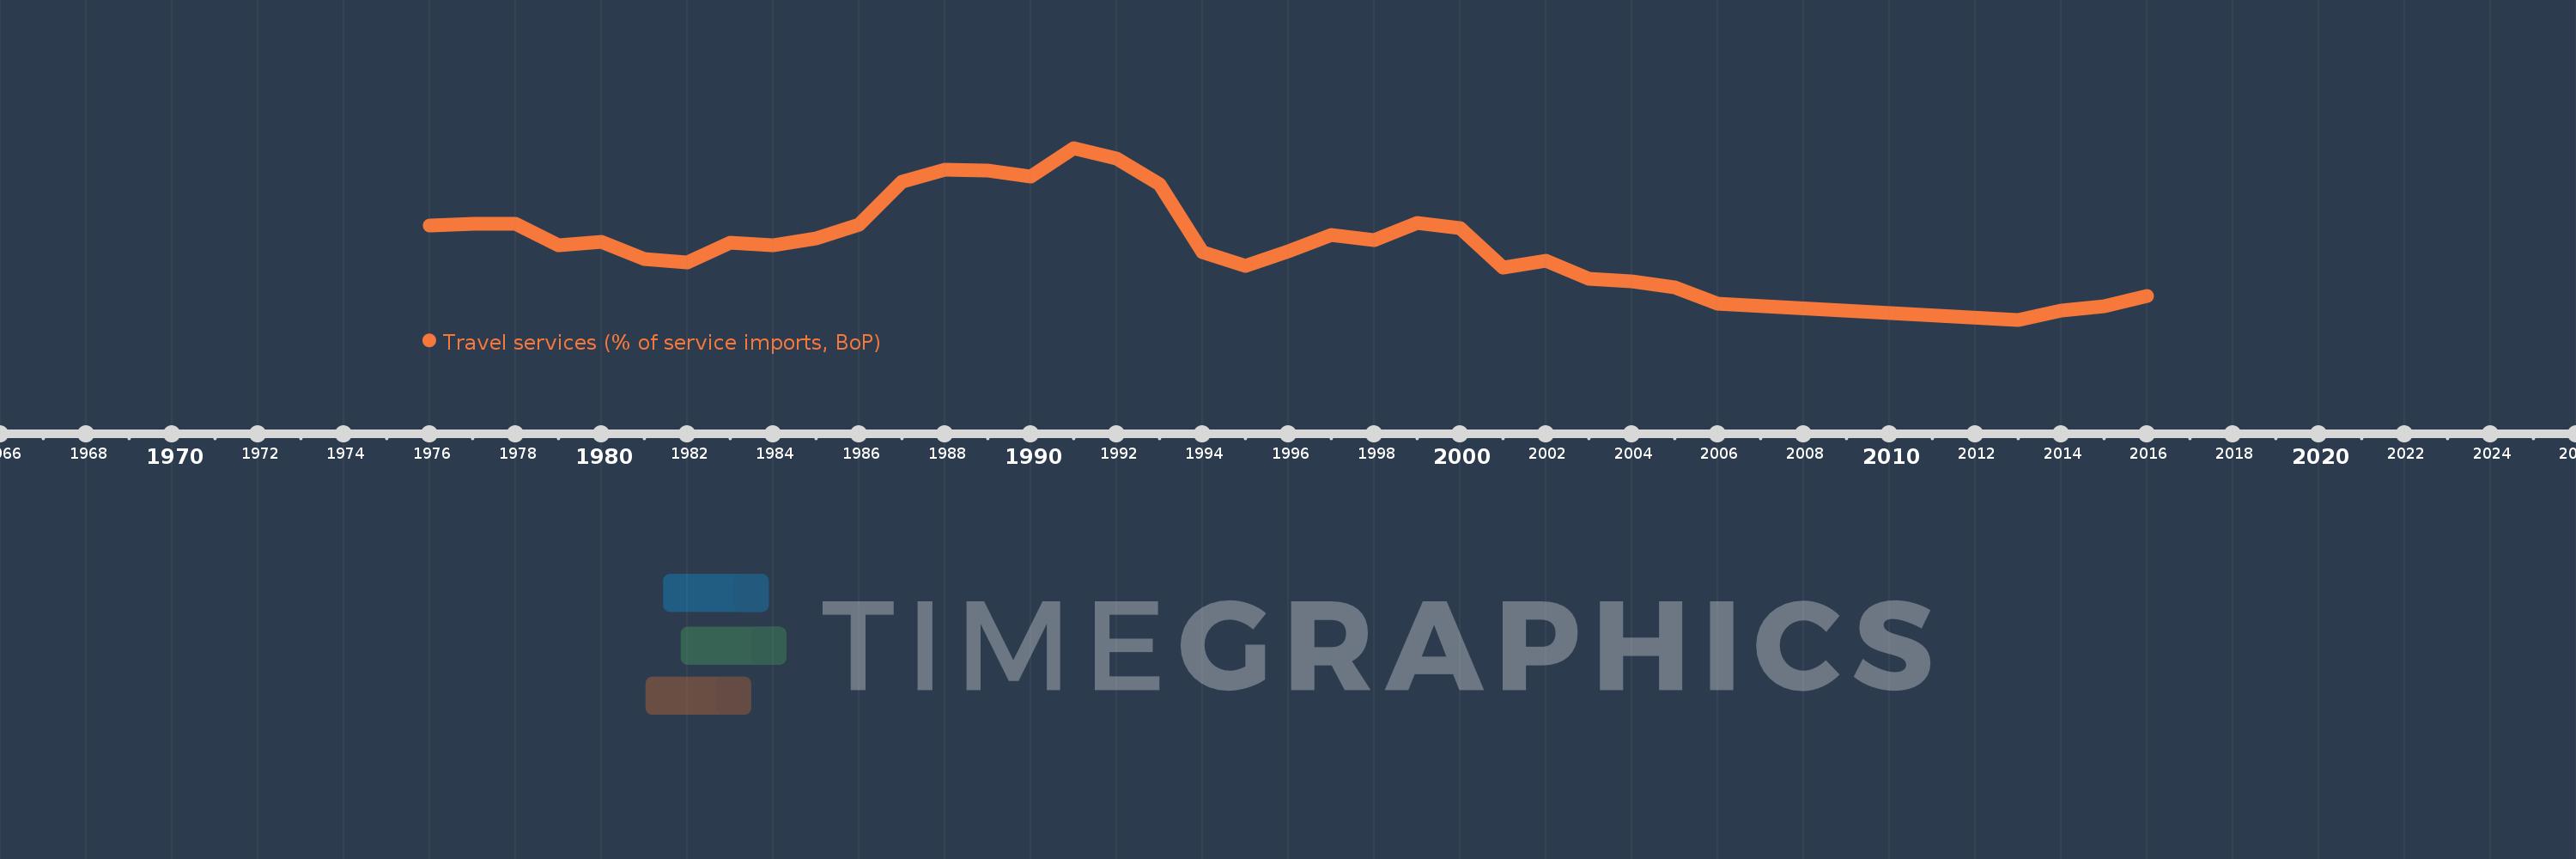
Travel services (% of service imports, BoP)
2016,2015,2014,2013,2006,2005,2004,2003,2002,2001,2000,1999,1998,1997,1996,1995,1994,1993,1992,1991,1990,1989,1988,1987,1986,1985,1984,1983,1982,1981,1980,1979,1978,1977,1976
This statistics in other country:
AfghanistanAlbaniaAlgeriaAngolaAntigua and BarbudaArab WorldArgentinaArmeniaArubaAustraliaAustriaAzerbaijanBahamas, TheBahrainBangladeshBarbadosBelarusBelgiumBelizeBeninBermudaBhutanBoliviaBosnia and HerzegovinaBotswanaBrazilBrunei DarussalamBulgariaBurkina FasoBurundiCabo VerdeCambodiaCameroonCanadaCaribbean small statesCentral African RepublicCentral Europe and the BalticsChadChileChinaColombiaComorosCongo, Dem. Rep.Congo, Rep.Costa RicaCote d'IvoireCroatiaCuracaoCyprusCzech RepublicDenmarkDjiboutiDominicaDominican RepublicEarly-demographic dividendEast Asia & PacificEast Asia & Pacific (excluding high income)East Asia & Pacific (IDA & IBRD countries)EcuadorEgypt, Arab Rep.El SalvadorEritreaEstoniaEthiopiaEuro areaEurope & Central AsiaEurope & Central Asia (excluding high income)Europe & Central Asia (IDA & IBRD countries)European UnionFaroe IslandsFijiFinlandFragile and conflict affected situationsFranceFrench PolynesiaGabonGambia, TheGeorgiaGermanyGhanaGreeceGrenadaGuatemalaGuineaGuinea-BissauGuyanaHaitiHeavily indebted poor countries (HIPC)High incomeHondurasHong Kong SAR, ChinaHungaryIBRD onlyIcelandIDA & IBRD totalIDA onlyIDA totalIndiaIndonesiaIran, Islamic Rep.IraqIrelandIsraelItalyJamaicaJapanJordanKazakhstanKenyaKiribatiKorea, Rep.KosovoKuwaitKyrgyz RepublicLao PDRLate-demographic dividendLatin America & Caribbean Latin America & Caribbean (excluding high income)Latin America & the Caribbean (IDA & IBRD countries)LatviaLeast developed countries: UN classificationLebanonLesothoLiberiaLibyaLithuaniaLow & middle incomeLow incomeLower middle incomeLuxembourgMacao SAR, ChinaMacedonia, FYRMadagascarMalawiMalaysiaMaldivesMaliMaltaMarshall IslandsMauritaniaMauritiusMexicoMicronesia, Fed. Sts.Middle East & North AfricaMiddle East & North Africa (excluding high income)Middle East & North Africa (IDA & IBRD countries)Middle incomeMoldovaMongoliaMontenegroMoroccoMozambiqueMyanmarNamibiaNepalNetherlandsNew CaledoniaNew ZealandNicaraguaNigerNigeriaNorth AmericaNorwayOECD membersOmanOther small statesPacific island small statesPakistanPalauPanamaPapua New GuineaParaguayPeruPhilippinesPolandPortugalPost-demographic dividendPre-demographic dividendQatarRomaniaRussian FederationRwandaSamoaSao Tome and PrincipeSaudi ArabiaSenegalSerbiaSeychellesSierra LeoneSingaporeSint Maarten (Dutch part)Slovak RepublicSloveniaSmall statesSolomon IslandsSouth AfricaSouth AsiaSouth Asia (IDA & IBRD)South SudanSpainSri LankaSt. Kitts and NevisSt. LuciaSt. Vincent and the GrenadinesSub-Saharan Africa Sub-Saharan Africa (excluding high income)Sub-Saharan Africa (IDA & IBRD countries)SudanSurinameSwazilandSwedenSwitzerlandSyrian Arab RepublicTajikistanTanzaniaThailandTimor-LesteTogoTongaTrinidad and TobagoTunisiaTurkeyTuvaluUgandaUkraineUnited KingdomUnited StatesUpper middle incomeUruguayVanuatuVenezuela, RBWest Bank and GazaWorldYemen, Rep.ZambiaZimbabwe Timeline:
This timeline shows a graph from 1976 to 2016 of Finland. No data until 1975. Number of actual observations by date: 35.
Source name:
World Development Indicators
Source organization:
International Monetary Fund, Balance of Payments Statistics Yearbook and data files.
Categories, topics:
Economy & Growth, Trade
Last updated:
apr 23, 2017
Indicators value changes by year
Minimum:
15.694
jan 1, 2013
Maximum:
36.086
jan 1, 1991
At the date of observation
Value
Absolute change
Change from previous value
jan 1, 1976
26.864
+26.864
0.0%
jan 1, 1977
27.12
+0.256
0.95%
jan 1, 1978
27.079
-0.041
-0.15%
jan 1, 1979
24.531
-2.548
-9.41%
jan 1, 1980
24.908
+0.377
1.54%
jan 1, 1981
22.905
-2.004
-8.04%
jan 1, 1982
22.47
-0.435
-1.9%
jan 1, 1983
24.886
+2.416
10.75%
jan 1, 1984
24.559
-0.327
-1.32%
jan 1, 1985
25.391
+0.832
3.39%
jan 1, 1986
27.01
+1.62
6.38%
jan 1, 1987
32.082
+5.071
18.78%
jan 1, 1988
33.495
+1.414
4.41%
jan 1, 1989
33.441
-0.055
-0.16%
jan 1, 1990
32.734
-0.707
-2.11%
jan 1, 1991
36.086
+3.352
10.24%
jan 1, 1992
34.878
-1.208
-3.35%
jan 1, 1993
31.733
-3.144
-9.02%
jan 1, 1994
23.693
-8.04
-25.34%
jan 1, 1995
22.046
-1.647
-6.95%
jan 1, 1996
23.81
+1.764
8.0%
jan 1, 1997
25.766
+1.955
8.21%
jan 1, 1998
25.095
-0.67
-2.6%
jan 1, 1999
27.142
+2.047
8.16%
jan 1, 2000
26.579
-0.563
-2.07%
jan 1, 2001
21.847
-4.732
-17.81%
jan 1, 2002
22.749
+0.903
4.13%
jan 1, 2003
20.583
-2.166
-9.52%
jan 1, 2004
20.276
-0.307
-1.49%
jan 1, 2005
19.554
-0.722
-3.56%
jan 1, 2006
17.624
-1.93
-9.87%
jan 1, 2013
15.694
-1.93
-10.95%
jan 1, 2014
16.781
+1.086
6.92%
jan 1, 2015
17.308
+0.527
3.14%
jan 1, 2016
18.519
+1.211
7.0%
Ranking of countries by current statistics by years


Comments: