29
/
en
AIzaSyAYiBZKx7MnpbEhh9jyipgxe19OcubqV5w
April 1, 2024
39633
IDA only
IDX
false
2
1
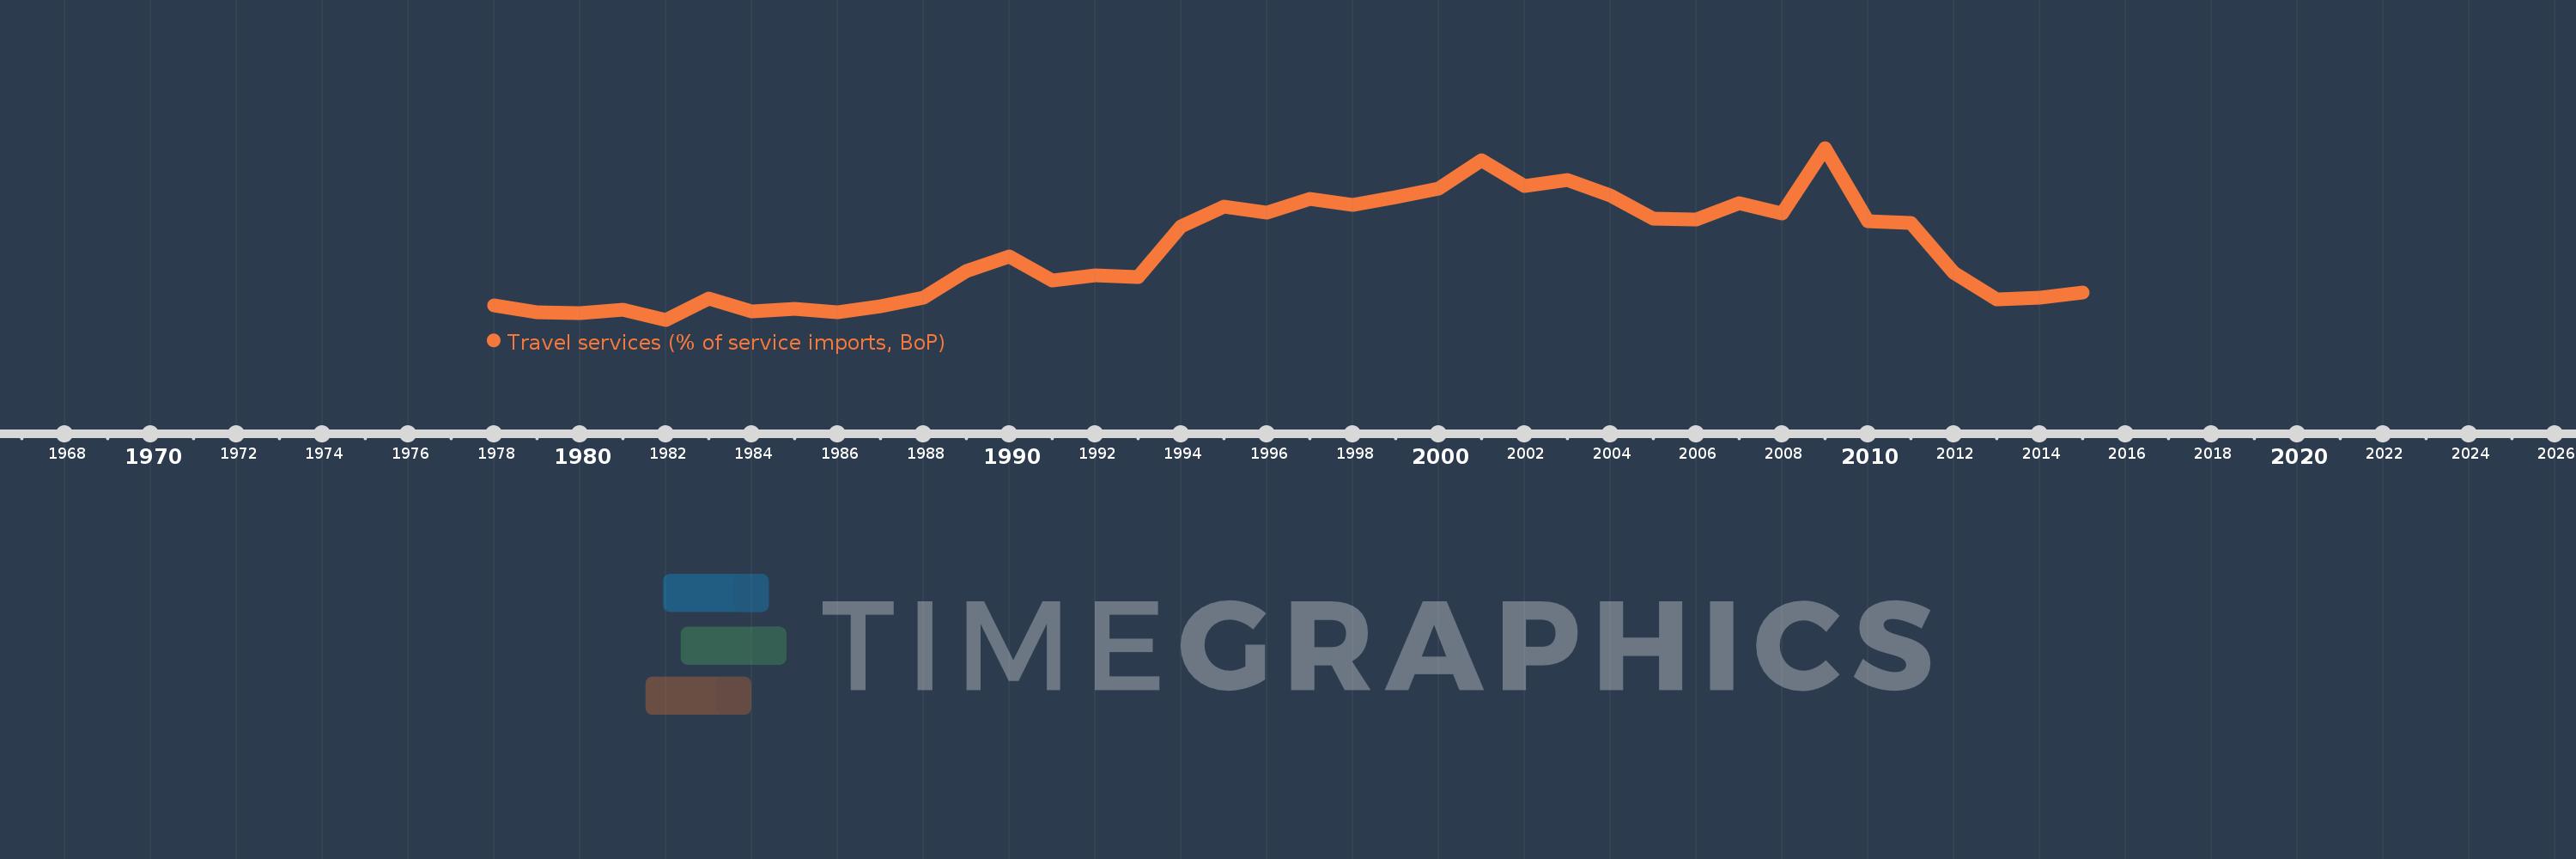
Travel services (% of service imports, BoP)
2015,2014,2013,2012,2011,2010,2009,2008,2007,2006,2005,2004,2003,2002,2001,2000,1999,1998,1997,1996,1995,1994,1993,1992,1991,1990,1989,1988,1987,1986,1985,1984,1983,1982,1981,1980,1979,1978
This statistics in other country:
AfghanistanAlbaniaAlgeriaAngolaAntigua and BarbudaArab WorldArgentinaArmeniaArubaAustraliaAustriaAzerbaijanBahamas, TheBahrainBangladeshBarbadosBelarusBelgiumBelizeBeninBermudaBhutanBoliviaBosnia and HerzegovinaBotswanaBrazilBrunei DarussalamBulgariaBurkina FasoBurundiCabo VerdeCambodiaCameroonCanadaCaribbean small statesCentral African RepublicCentral Europe and the BalticsChadChileChinaColombiaComorosCongo, Dem. Rep.Congo, Rep.Costa RicaCote d'IvoireCroatiaCuracaoCyprusCzech RepublicDenmarkDjiboutiDominicaDominican RepublicEarly-demographic dividendEast Asia & PacificEast Asia & Pacific (excluding high income)East Asia & Pacific (IDA & IBRD countries)EcuadorEgypt, Arab Rep.El SalvadorEritreaEstoniaEthiopiaEuro areaEurope & Central AsiaEurope & Central Asia (excluding high income)Europe & Central Asia (IDA & IBRD countries)European UnionFaroe IslandsFijiFinlandFragile and conflict affected situationsFranceFrench PolynesiaGabonGambia, TheGeorgiaGermanyGhanaGreeceGrenadaGuatemalaGuineaGuinea-BissauGuyanaHaitiHeavily indebted poor countries (HIPC)High incomeHondurasHong Kong SAR, ChinaHungaryIBRD onlyIcelandIDA & IBRD totalIDA onlyIDA totalIndiaIndonesiaIran, Islamic Rep.IraqIrelandIsraelItalyJamaicaJapanJordanKazakhstanKenyaKiribatiKorea, Rep.KosovoKuwaitKyrgyz RepublicLao PDRLate-demographic dividendLatin America & Caribbean Latin America & Caribbean (excluding high income)Latin America & the Caribbean (IDA & IBRD countries)LatviaLeast developed countries: UN classificationLebanonLesothoLiberiaLibyaLithuaniaLow & middle incomeLow incomeLower middle incomeLuxembourgMacao SAR, ChinaMacedonia, FYRMadagascarMalawiMalaysiaMaldivesMaliMaltaMarshall IslandsMauritaniaMauritiusMexicoMicronesia, Fed. Sts.Middle East & North AfricaMiddle East & North Africa (excluding high income)Middle East & North Africa (IDA & IBRD countries)Middle incomeMoldovaMongoliaMontenegroMoroccoMozambiqueMyanmarNamibiaNepalNetherlandsNew CaledoniaNew ZealandNicaraguaNigerNigeriaNorth AmericaNorwayOECD membersOmanOther small statesPacific island small statesPakistanPalauPanamaPapua New GuineaParaguayPeruPhilippinesPolandPortugalPost-demographic dividendPre-demographic dividendQatarRomaniaRussian FederationRwandaSamoaSao Tome and PrincipeSaudi ArabiaSenegalSerbiaSeychellesSierra LeoneSingaporeSint Maarten (Dutch part)Slovak RepublicSloveniaSmall statesSolomon IslandsSouth AfricaSouth AsiaSouth Asia (IDA & IBRD)South SudanSpainSri LankaSt. Kitts and NevisSt. LuciaSt. Vincent and the GrenadinesSub-Saharan Africa Sub-Saharan Africa (excluding high income)Sub-Saharan Africa (IDA & IBRD countries)SudanSurinameSwazilandSwedenSwitzerlandSyrian Arab RepublicTajikistanTanzaniaThailandTimor-LesteTogoTongaTrinidad and TobagoTunisiaTurkeyTuvaluUgandaUkraineUnited KingdomUnited StatesUpper middle incomeUruguayVanuatuVenezuela, RBWest Bank and GazaWorldYemen, Rep.ZambiaZimbabwe Timeline:
This timeline shows a graph from 1978 to 2015 of IDA only. No data until 1977. Number of actual observations by date: 38.
Source name:
World Development Indicators
Source organization:
International Monetary Fund, Balance of Payments Statistics Yearbook and data files.
Categories, topics:
Economy & Growth, Trade
Last updated:
apr 23, 2017
Indicators value changes by year
Maximum:
23.125
jan 1, 2009
At the date of observation
Value
Absolute change
Change from previous value
jan 1, 1978
12.836
+12.836
0.0%
jan 1, 1979
12.345
-0.491
-3.82%
jan 1, 1980
12.307
-0.038
-0.31%
jan 1, 1981
12.536
+0.229
1.86%
jan 1, 1982
11.88
-0.656
-5.23%
jan 1, 1983
13.248
+1.368
11.52%
jan 1, 1984
12.43
-0.818
-6.17%
jan 1, 1985
12.606
+0.176
1.42%
jan 1, 1986
12.374
-0.232
-1.84%
jan 1, 1987
12.756
+0.382
3.09%
jan 1, 1988
13.332
+0.575
4.51%
jan 1, 1989
15.07
+1.738
13.04%
jan 1, 1990
16.029
+0.96
6.37%
jan 1, 1991
14.457
-1.572
-9.81%
jan 1, 1992
14.783
+0.326
2.25%
jan 1, 1993
14.671
-0.112
-0.76%
jan 1, 1994
17.979
+3.308
22.55%
jan 1, 1995
19.302
+1.323
7.36%
jan 1, 1996
18.869
-0.433
-2.25%
jan 1, 1997
19.803
+0.934
4.95%
jan 1, 1998
19.406
-0.396
-2.0%
jan 1, 1999
19.902
+0.496
2.55%
jan 1, 2000
20.481
+0.579
2.91%
jan 1, 2001
22.322
+1.841
8.99%
jan 1, 2002
20.63
-1.692
-7.58%
jan 1, 2003
21.024
+0.393
1.91%
jan 1, 2004
20.023
-1.001
-4.76%
jan 1, 2005
18.5
-1.523
-7.61%
jan 1, 2006
18.428
-0.072
-0.39%
jan 1, 2007
19.531
+1.103
5.98%
jan 1, 2008
18.858
-0.673
-3.45%
jan 1, 2009
23.125
+4.267
22.63%
jan 1, 2010
18.355
-4.77
-20.63%
jan 1, 2011
18.239
-0.116
-0.63%
jan 1, 2012
14.937
-3.302
-18.1%
jan 1, 2013
13.223
-1.714
-11.47%
jan 1, 2014
13.334
+0.111
0.84%
jan 1, 2015
13.636
+0.302
2.27%
Ranking of countries by current statistics by years


Comments: