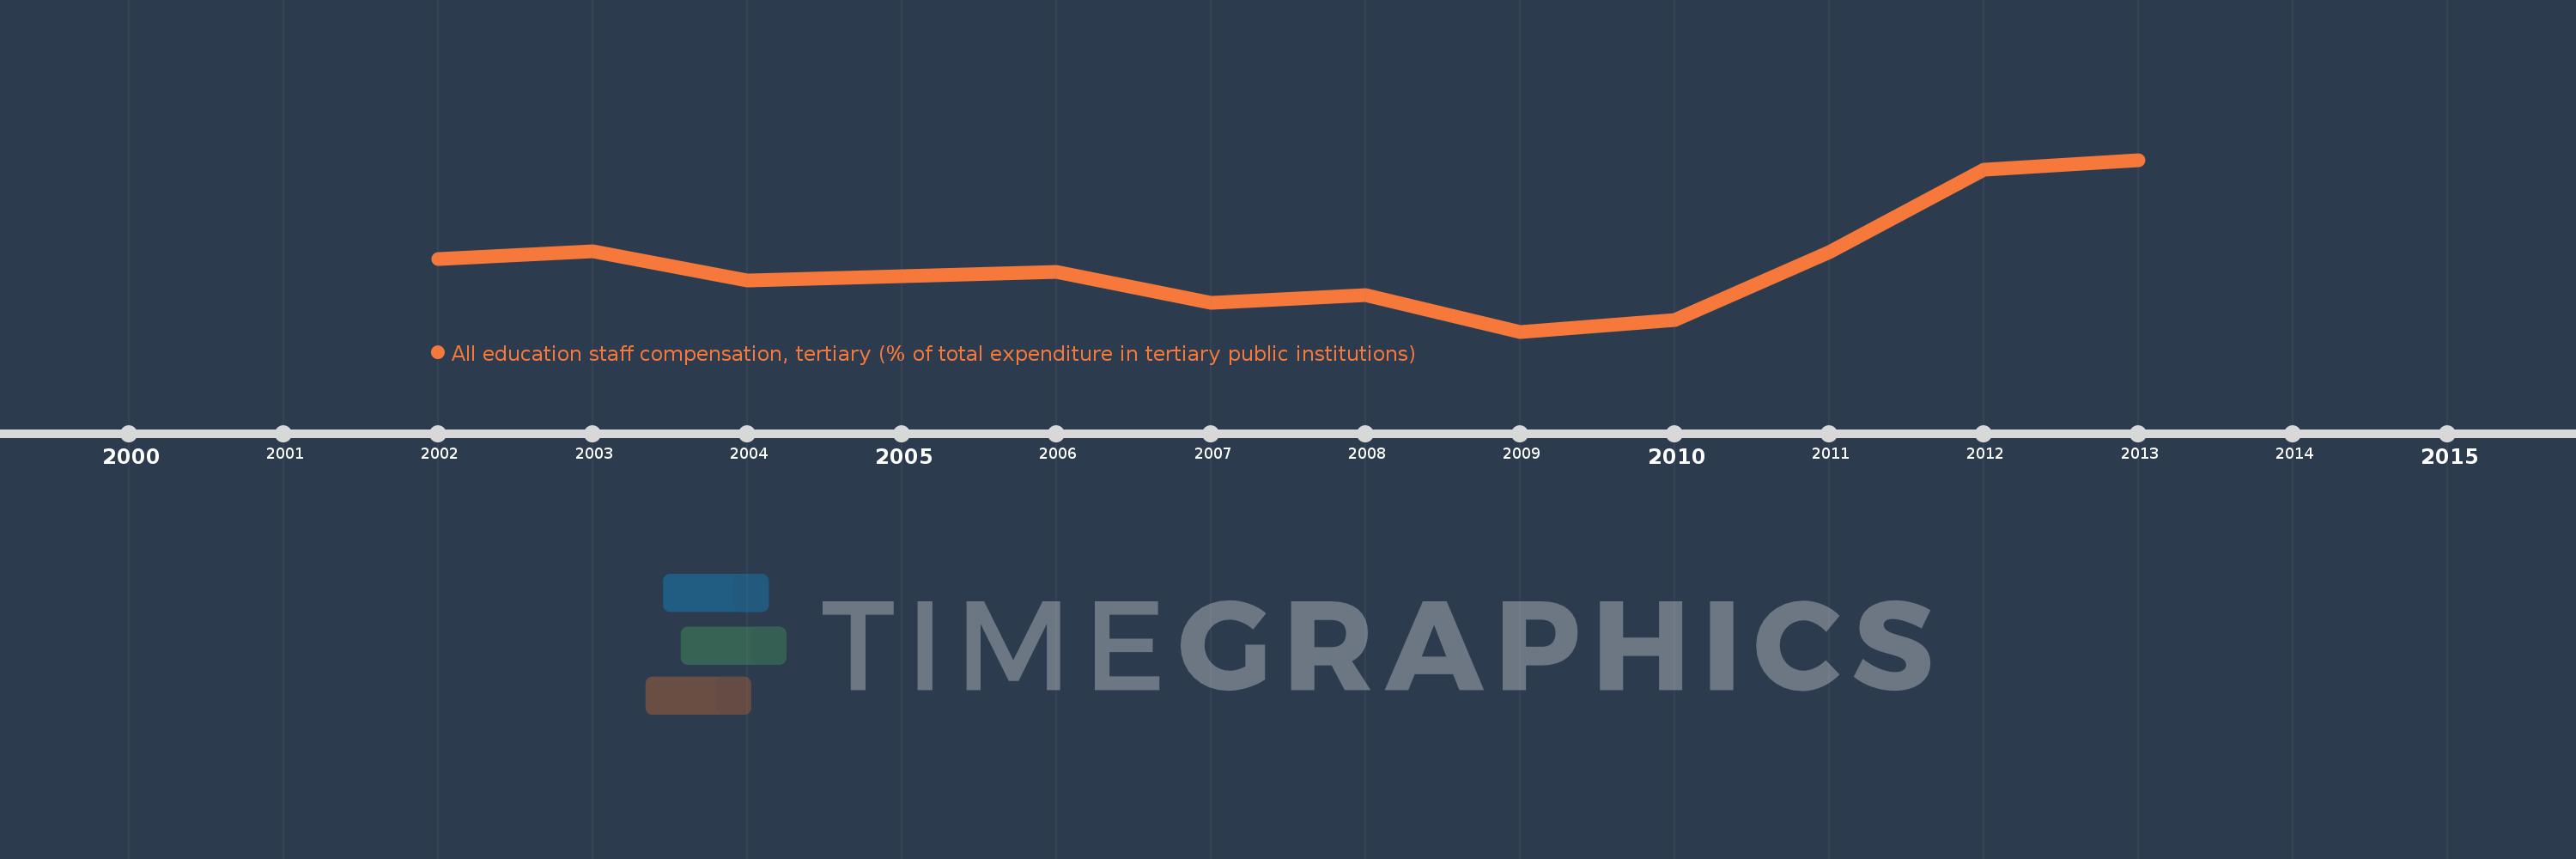
Questa scala temporale mostra un grafico dal 2002 anno al 2013 anno. Bulgaria. I dati fino ad 2001 anno non disponibili. Il numero di osservazioni attuali secondo i date: 11.
La fonte (nome):
Indicatori dello sviluppo mondiale
La fonte (organizzazione):
United Nations Educational, Scientific, and Cultural Organization (UNESCO) Institute for Statistics.
Categorie:
Education
sono stati aggiornati
23 apr 2017 anni
Indicatori delle variazioni dei valori per anni
In media:
60.102
Minima:
43.52
1 gen 2009 anni
Massimo:
85.149
1 gen 2013 anni
Alla data di osservazione
Valore
Variazione assoluta
La variazione rispetto al valore precedente
1 gen 2002 anni
61.018
+61.018
0.0%
1 gen 2003 anni
63.059
+2.041
3.34%
1 gen 2004 anni
55.835
-7.223
-11.45%
1 gen 2006 anni
57.926
+2.09
3.74%
1 gen 2007 anni
50.416
-7.51
-12.96%
1 gen 2008 anni
52.343
+1.927
3.82%
1 gen 2009 anni
43.52
-8.823
-16.86%
1 gen 2010 anni
46.381
+2.861
6.57%
1 gen 2011 anni
62.759
+16.378
35.31%
1 gen 2012 anni
82.718
+19.958
31.8%
1 gen 2013 anni
85.149
+2.432
2.94%
Classificazione dei paesi secondo i statistiche attuali per anni