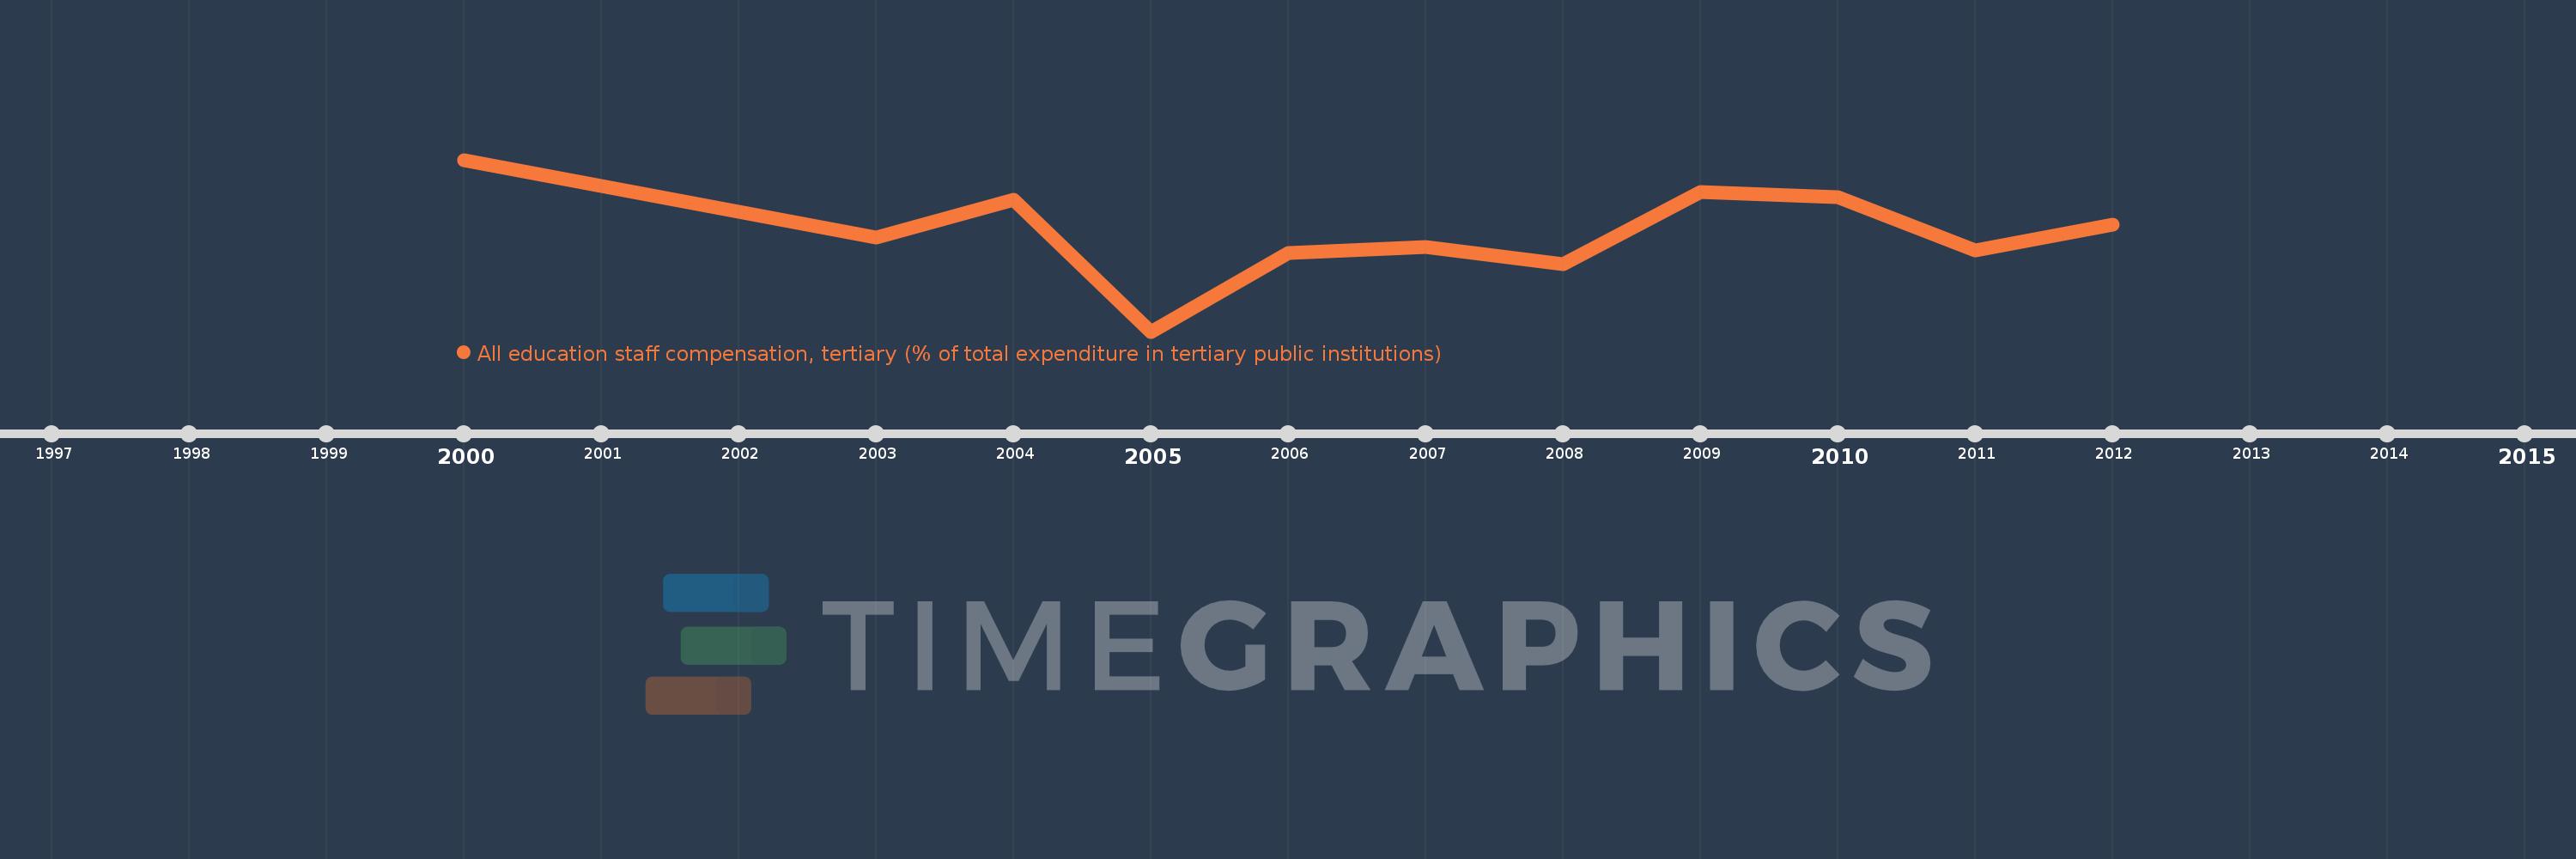
Questa scala temporale mostra un grafico dal 2000 anno al 2012 anno. Chile. I dati fino ad 1999 anno non disponibili. Il numero di osservazioni attuali secondo i date: 11.
La fonte (nome):
Indicatori dello sviluppo mondiale
La fonte (organizzazione):
United Nations Educational, Scientific, and Cultural Organization (UNESCO) Institute for Statistics.
Categorie:
Education
sono stati aggiornati
23 apr 2017 anni
Indicatori delle variazioni dei valori per anni
In media:
60.114
Minima:
55.239
1 gen 2005 anni
Massimo:
63.695
1 gen 2000 anni
Alla data di osservazione
Valore
Variazione assoluta
La variazione rispetto al valore precedente
1 gen 2000 anni
63.695
+63.695
0.0%
1 gen 2003 anni
59.854
-3.841
-6.03%
1 gen 2004 anni
61.729
+1.874
3.13%
1 gen 2005 anni
55.239
-6.49
-10.51%
1 gen 2006 anni
59.094
+3.855
6.98%
1 gen 2007 anni
59.407
+0.313
0.53%
1 gen 2008 anni
58.555
-0.852
-1.43%
1 gen 2009 anni
62.092
+3.537
6.04%
1 gen 2010 anni
61.857
-0.236
-0.38%
1 gen 2011 anni
59.24
-2.616
-4.23%
1 gen 2012 anni
60.487
+1.247
2.11%
Classificazione dei paesi secondo i statistiche attuali per anni