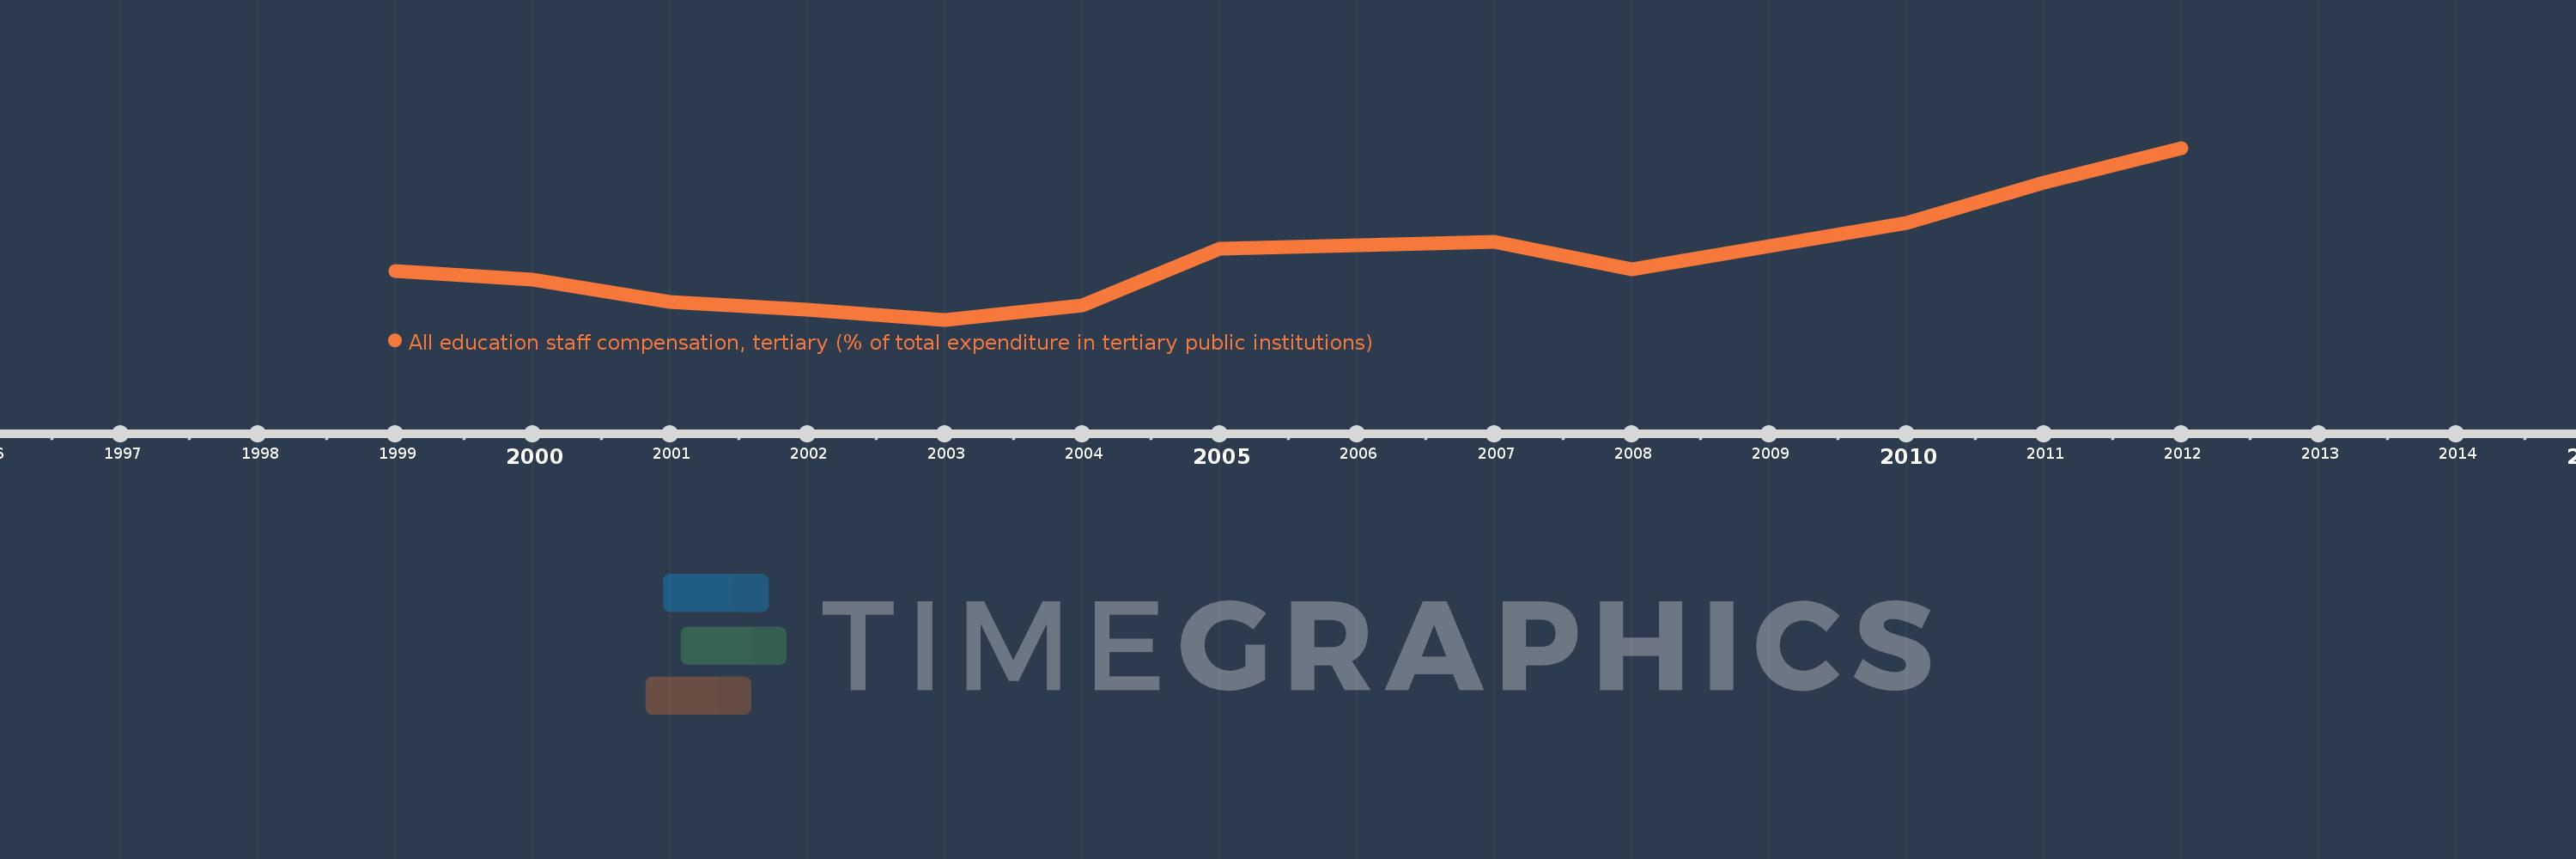
Questa scala temporale mostra un grafico dal 1999 anno al 2012 anno. Malaysia. I dati fino ad 1998 anno non disponibili. Il numero di osservazioni attuali secondo i date: 12.
La fonte (nome):
Indicatori dello sviluppo mondiale
La fonte (organizzazione):
United Nations Educational, Scientific, and Cultural Organization (UNESCO) Institute for Statistics.
Categorie:
Education
sono stati aggiornati
23 apr 2017 anni
Indicatori delle variazioni dei valori per anni
In media:
38.5
Minima:
18.638
1 gen 2003 anni
Massimo:
74.274
1 gen 2012 anni
Alla data di osservazione
Valore
Variazione assoluta
La variazione rispetto al valore precedente
1 gen 1999 anni
34.415
+34.415
0.0%
1 gen 2000 anni
31.712
-2.703
-7.85%
1 gen 2001 anni
24.328
-7.384
-23.28%
1 gen 2002 anni
21.879
-2.45
-10.07%
1 gen 2003 anni
18.638
-3.24
-14.81%
1 gen 2004 anni
23.395
+4.757
25.52%
1 gen 2005 anni
41.679
+18.284
78.15%
1 gen 2007 anni
43.734
+2.055
4.93%
1 gen 2008 anni
34.902
-8.832
-20.2%
1 gen 2010 anni
49.998
+15.096
43.25%
1 gen 2011 anni
63.043
+13.046
26.09%
1 gen 2012 anni
74.274
+11.231
17.81%
Classificazione dei paesi secondo i statistiche attuali per anni