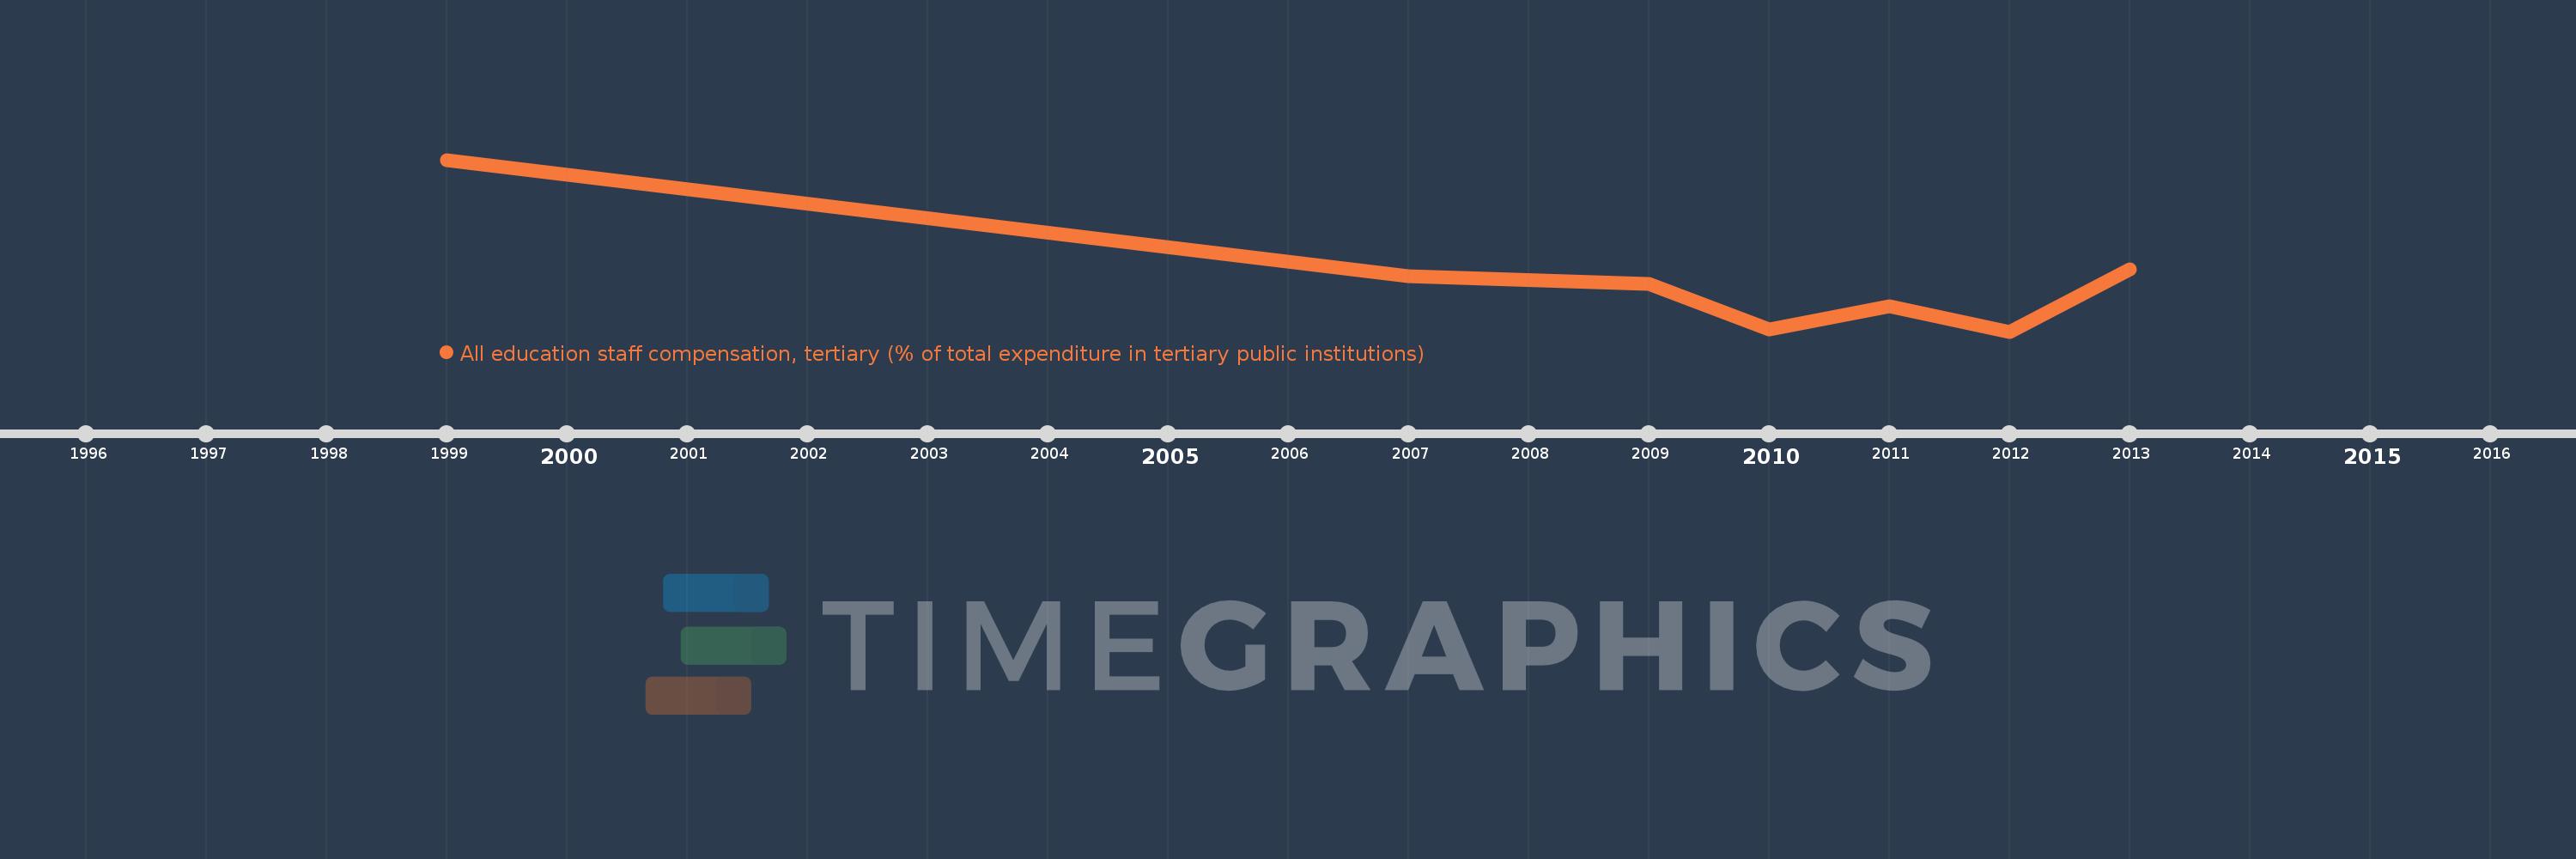
Questa scala temporale mostra un grafico dal 1999 anno al 2013 anno. Canada. I dati fino ad 1998 anno non disponibili. Il numero di osservazioni attuali secondo i date: 7.
La fonte (nome):
Indicatori dello sviluppo mondiale
La fonte (organizzazione):
United Nations Educational, Scientific, and Cultural Organization (UNESCO) Institute for Statistics.
Categorie:
Education
sono stati aggiornati
23 apr 2017 anni
Indicatori delle variazioni dei valori per anni
In media:
58.677
Minima:
55.768
1 gen 2012 anni
Massimo:
65.375
1 gen 1999 anni
Alla data di osservazione
Valore
Variazione assoluta
La variazione rispetto al valore precedente
1 gen 1999 anni
65.375
+65.375
0.0%
1 gen 2007 anni
58.845
-6.53
-9.99%
1 gen 2009 anni
58.442
-0.403
-0.69%
1 gen 2010 anni
55.865
-2.577
-4.41%
1 gen 2011 anni
57.202
+1.337
2.39%
1 gen 2012 anni
55.768
-1.435
-2.51%
1 gen 2013 anni
59.242
+3.475
6.23%
Classificazione dei paesi secondo i statistiche attuali per anni