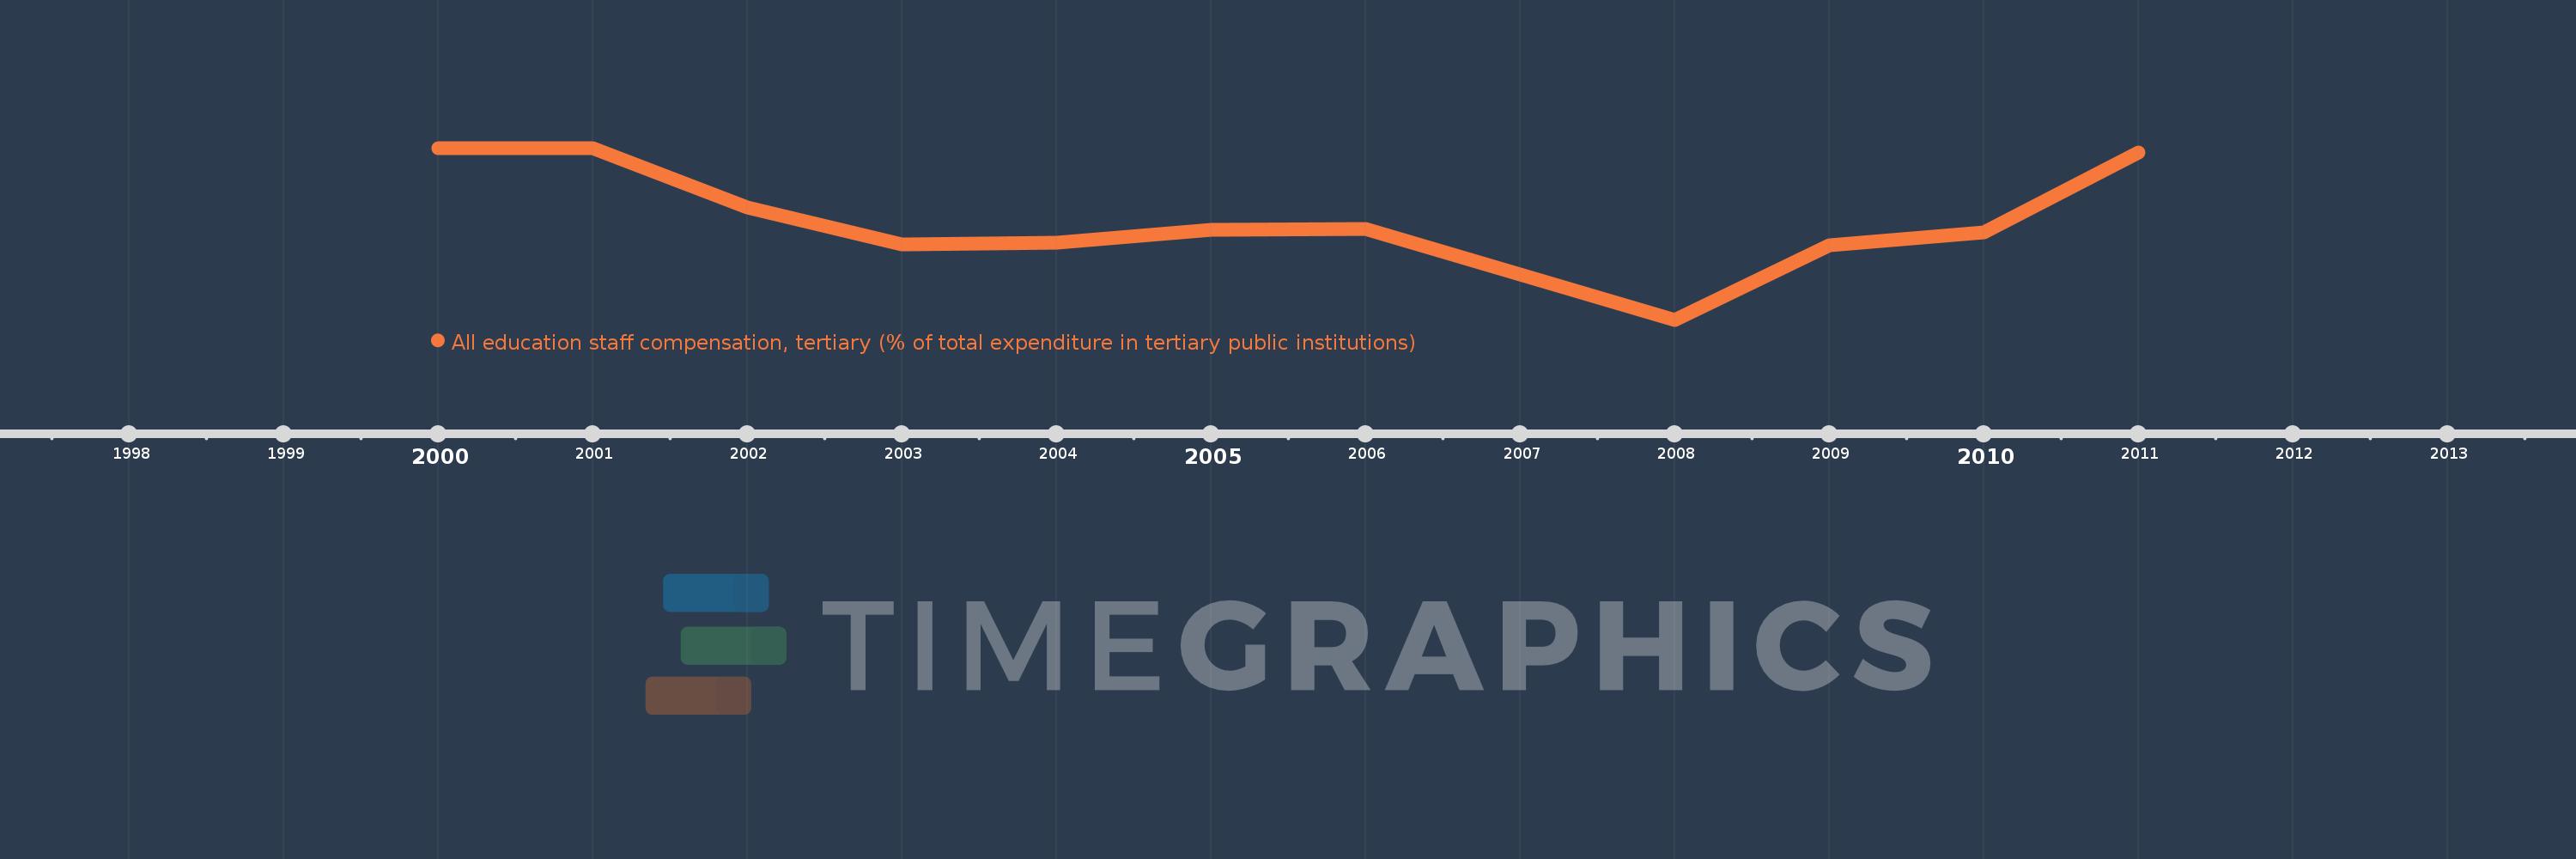
Questa scala temporale mostra un grafico dal 2000 anno al 2011 anno. Barbados. I dati fino ad 1999 anno non disponibili. Il numero di osservazioni attuali secondo i date: 11.
La fonte (nome):
Indicatori dello sviluppo mondiale
La fonte (organizzazione):
United Nations Educational, Scientific, and Cultural Organization (UNESCO) Institute for Statistics.
Categorie:
Education
sono stati aggiornati
23 apr 2017 anni
Indicatori delle variazioni dei valori per anni
In media:
92.149
Minima:
80.768
1 gen 2008 anni
Massimo:
100.0
1 gen 2000 anni
Alla data di osservazione
Valore
Variazione assoluta
La variazione rispetto al valore precedente
1 gen 2000 anni
100.0
+100.0
0.0%
1 gen 2001 anni
100.0
0.0
0.0%
1 gen 2002 anni
93.321
-6.679
-6.68%
1 gen 2003 anni
89.169
-4.152
-4.45%
1 gen 2004 anni
89.384
+0.215
0.24%
1 gen 2005 anni
90.867
+1.483
1.66%
1 gen 2006 anni
90.954
+0.087
0.1%
1 gen 2008 anni
80.768
-10.186
-11.2%
1 gen 2009 anni
89.152
+8.384
10.38%
1 gen 2010 anni
90.51
+1.359
1.52%
1 gen 2011 anni
99.51
+8.999
9.94%
Classificazione dei paesi secondo i statistiche attuali per anni