Download Queste statistiche in altri paesi:
Linea del tempo:
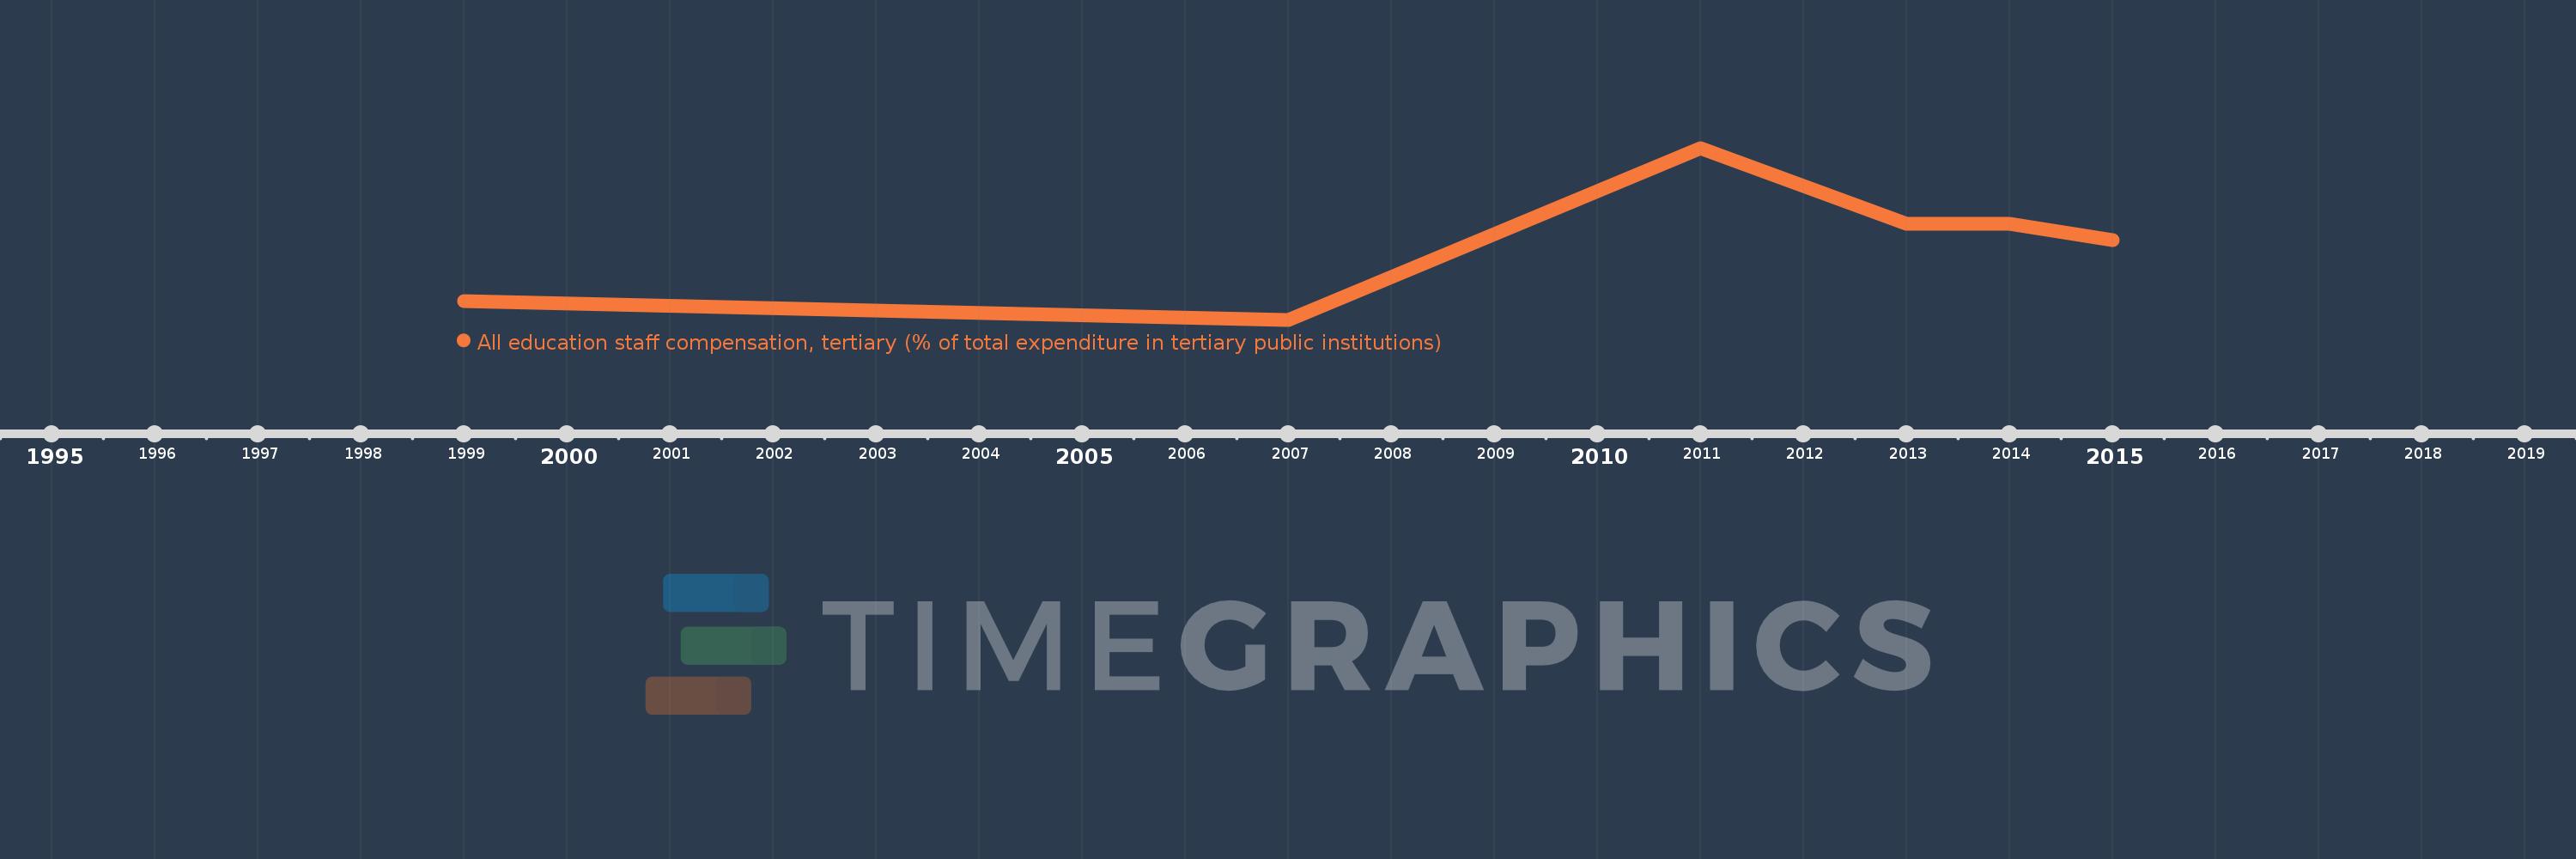
Questa scala temporale mostra un grafico dal 1999 anno al 2015 anno. Benin. I dati fino ad 1998 anno non disponibili. Il numero di osservazioni attuali secondo i date: 6.
La fonte (nome):
Indicatori dello sviluppo mondiale
La fonte (organizzazione):
United Nations Educational, Scientific, and Cultural Organization (UNESCO) Institute for Statistics.
Categorie:
Education
sono stati aggiornati
23 apr 2017 anni
Indicatori delle variazioni dei valori per anni
Minima:
47.784
1 gen 2007 anni
Massimo:
87.545
1 gen 2011 anni
Alla data di osservazione
Valore
Variazione assoluta
La variazione rispetto al valore precedente
1 gen 1999 anni
52.088
+52.088
0.0%
1 gen 2007 anni
47.784
-4.305
-8.26%
1 gen 2011 anni
87.545
+39.762
83.21%
1 gen 2013 anni
69.978
-17.568
-20.07%
1 gen 2014 anni
69.957
-0.021
-0.03%
1 gen 2015 anni
66.16
-3.796
-5.43%
Classificazione dei paesi secondo i statistiche attuali per anni