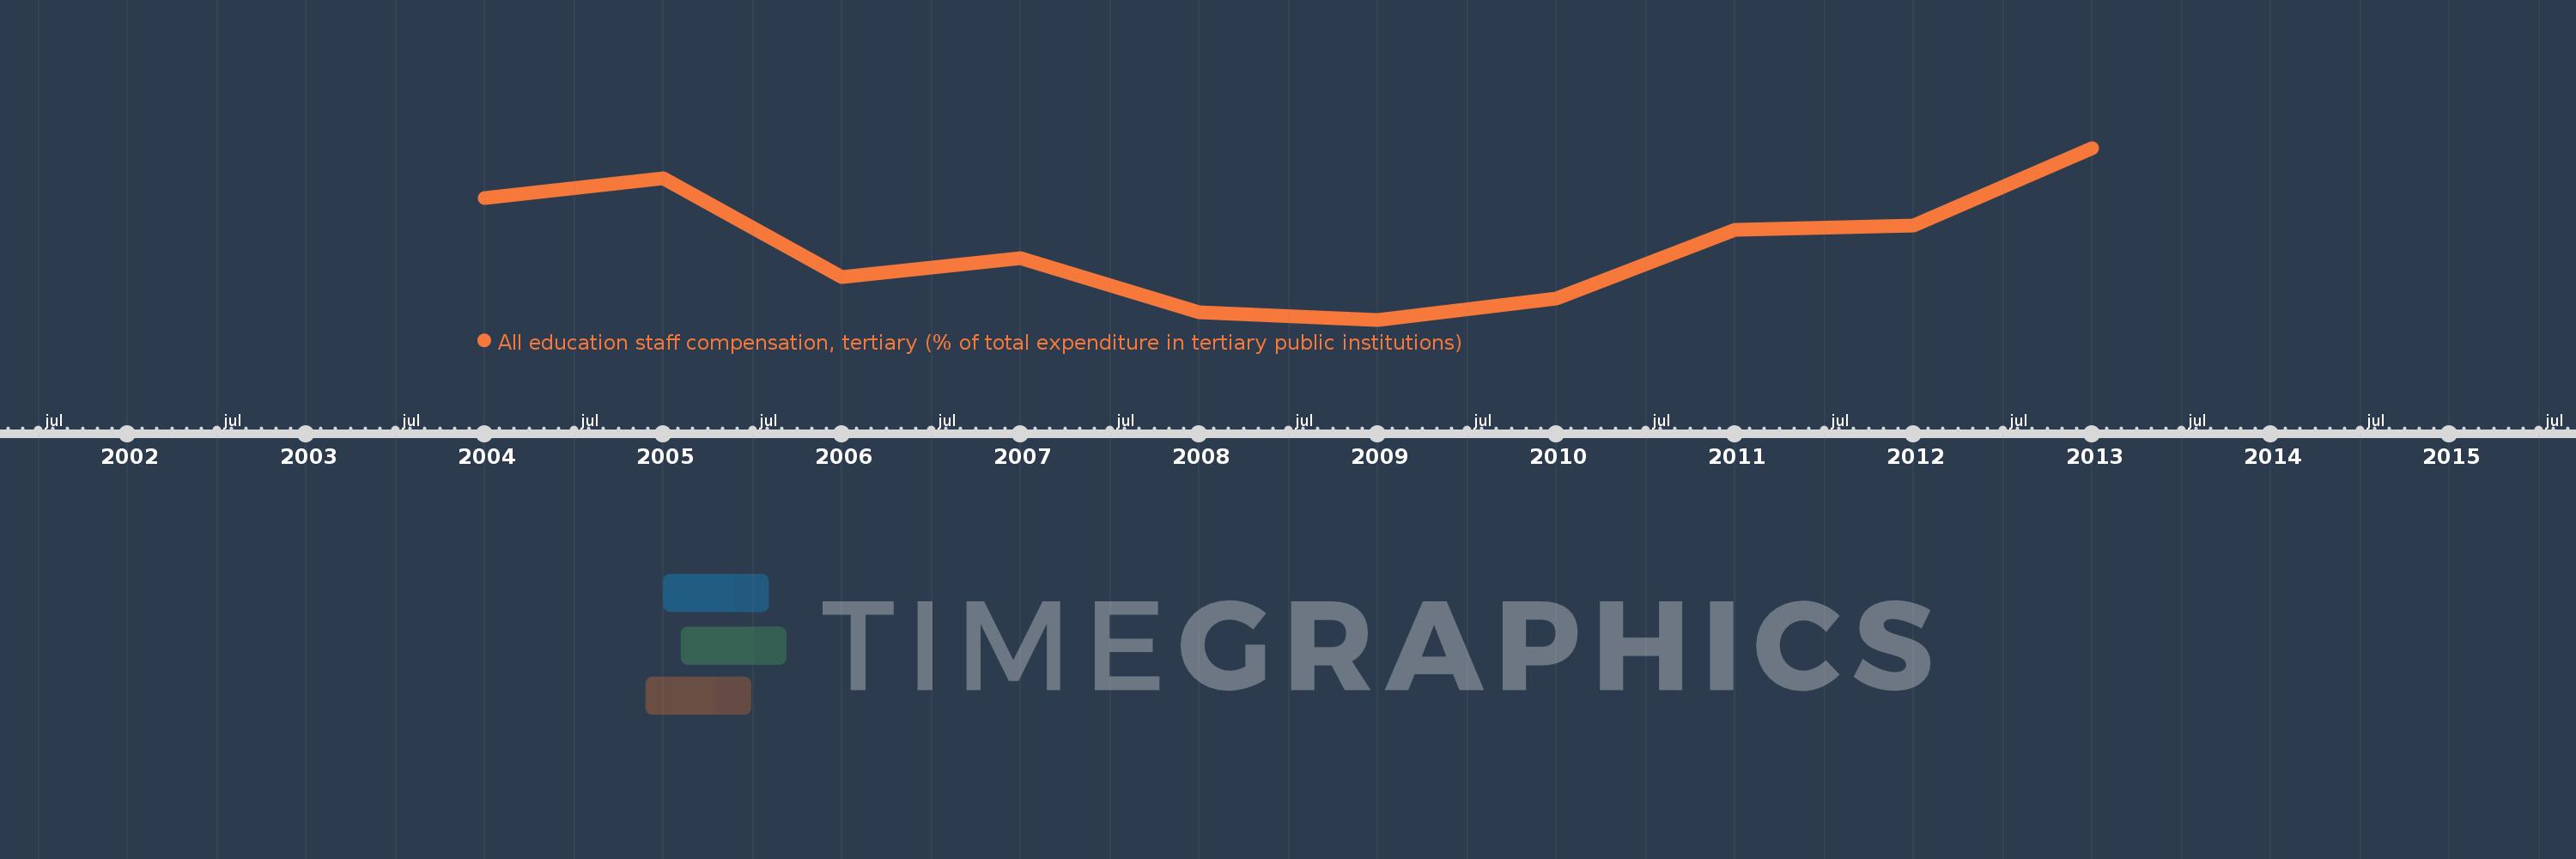
Questa scala temporale mostra un grafico dal 2004 anno al 2013 anno. Slovenia. I dati fino ad 2003 anno non disponibili. Il numero di osservazioni attuali secondo i date: 10.
La fonte (nome):
Indicatori dello sviluppo mondiale
La fonte (organizzazione):
United Nations Educational, Scientific, and Cultural Organization (UNESCO) Institute for Statistics.
Categorie:
Education
sono stati aggiornati
23 apr 2017 anni
Indicatori delle variazioni dei valori per anni
In media:
62.231
Minima:
60.198
1 gen 2009 anni
Massimo:
64.841
1 gen 2013 anni
Alla data di osservazione
Valore
Variazione assoluta
La variazione rispetto al valore precedente
1 gen 2004 anni
63.486
+63.486
0.0%
1 gen 2005 anni
64.031
+0.545
0.86%
1 gen 2006 anni
61.36
-2.671
-4.17%
1 gen 2007 anni
61.854
+0.494
0.8%
1 gen 2008 anni
60.389
-1.465
-2.37%
1 gen 2009 anni
60.198
-0.191
-0.32%
1 gen 2010 anni
60.78
+0.582
0.97%
1 gen 2011 anni
62.627
+1.847
3.04%
1 gen 2012 anni
62.745
+0.118
0.19%
1 gen 2013 anni
64.841
+2.096
3.34%
Classificazione dei paesi secondo i statistiche attuali per anni