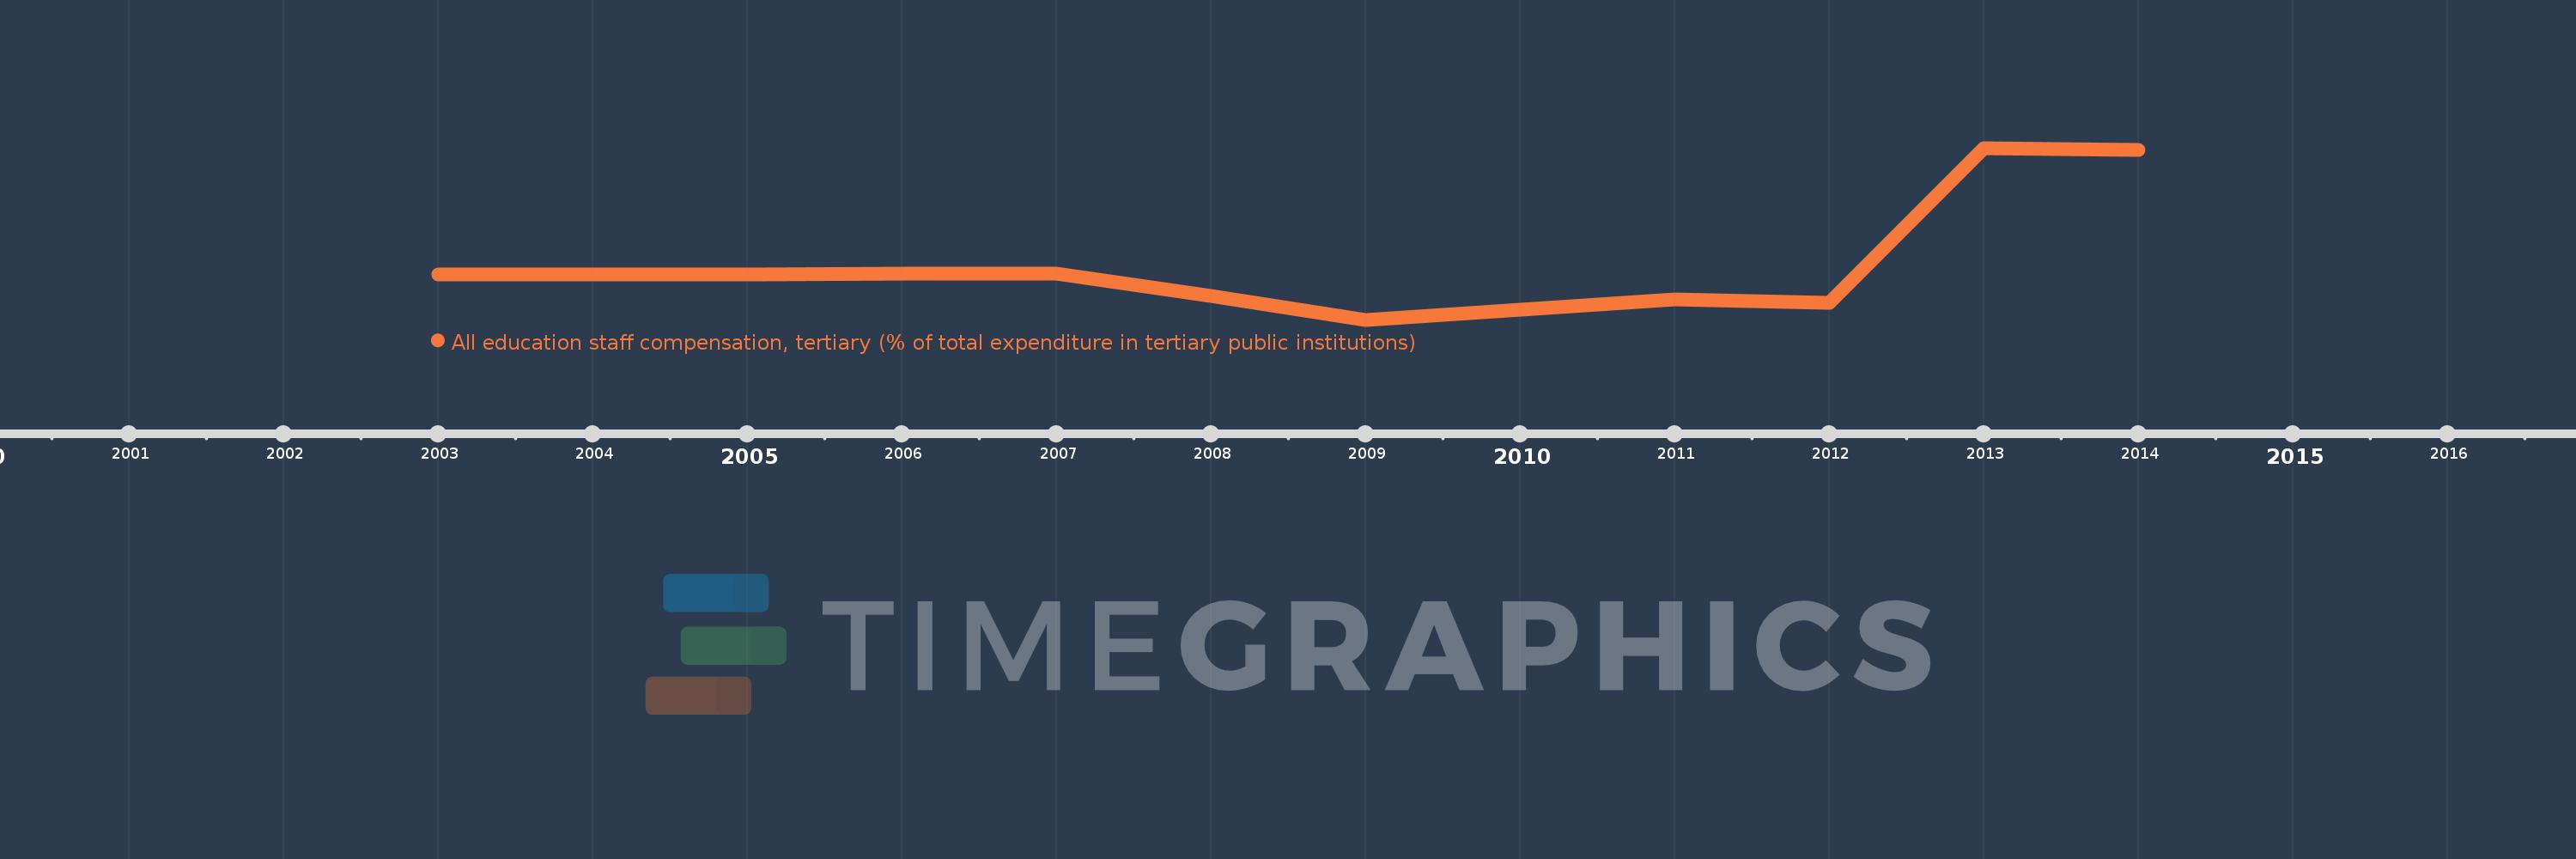
Questa scala temporale mostra un grafico dal 2003 anno al 2014 anno. Lebanon. I dati fino ad 2002 anno non disponibili. Il numero di osservazioni attuali secondo i date: 10.
La fonte (nome):
Indicatori dello sviluppo mondiale
La fonte (organizzazione):
United Nations Educational, Scientific, and Cultural Organization (UNESCO) Institute for Statistics.
Categorie:
Education
sono stati aggiornati
23 apr 2017 anni
Indicatori delle variazioni dei valori per anni
In media:
98.013
Minima:
97.054
1 gen 2009 anni
Massimo:
99.864
1 gen 2013 anni
Alla data di osservazione
Valore
Variazione assoluta
La variazione rispetto al valore precedente
1 gen 2003 anni
97.798
+97.798
0.0%
1 gen 2005 anni
97.798
+0.0
0.0%
1 gen 2006 anni
97.815
+0.017
0.02%
1 gen 2007 anni
97.815
0.0
0.0%
1 gen 2008 anni
97.449
-0.366
-0.37%
1 gen 2009 anni
97.054
-0.395
-0.41%
1 gen 2011 anni
97.38
+0.327
0.34%
1 gen 2012 anni
97.324
-0.057
-0.06%
1 gen 2013 anni
99.864
+2.541
2.61%
1 gen 2014 anni
99.831
-0.033
-0.03%
Classificazione dei paesi secondo i statistiche attuali per anni